# Technical Data Extraction: Flow Length Frequency Distribution
## 1. Document Overview
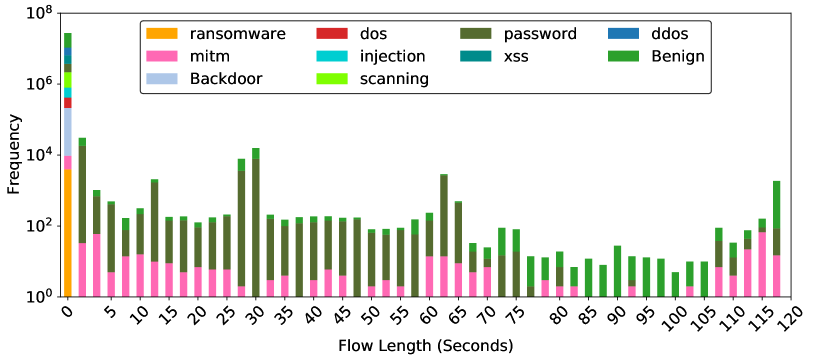
This image is a stacked bar chart (histogram) representing the frequency of network traffic flows categorized by their duration (Flow Length) and their classification type (attack type vs. benign).
## 2. Component Isolation
### A. Header / Legend
The legend is located at the top center of the chart area, enclosed in a black border. It contains 11 categories, each associated with a specific color:
| Category | Color | Description |
| :--- | :--- | :--- |
| **ransomware** | Orange | Attack type |
| **mitm** | Pink | Man-in-the-Middle attack |
| **Backdoor** | Light Blue | Attack type |
| **dos** | Red | Denial of Service attack |
| **injection** | Cyan | Attack type |
| **scanning** | Neon Green | Attack type |
| **password** | Dark Olive Green | Attack type |
| **xss** | Teal | Cross-Site Scripting attack |
| **ddos** | Blue | Distributed Denial of Service |
| **Benign** | Forest Green | Normal/Safe traffic |
### B. Axis Definitions
* **Y-Axis (Vertical):**
* **Label:** Frequency
* **Scale:** Logarithmic ($10^0$ to $10^8$).
* **Markers:** $10^0, 10^2, 10^4, 10^6, 10^8$.
* **X-Axis (Horizontal):**
* **Label:** Flow Length (Seconds)
* **Scale:** Linear (0 to 120 seconds).
* **Markers:** Increments of 5 (0, 5, 10, 15, 20, 25, 30, 35, 40, 45, 50, 55, 60, 65, 70, 75, 80, 85, 90, 95, 100, 105, 110, 115, 120).
---
## 3. Data Analysis and Trends
### General Distribution Trend
The chart shows a heavy "long-tail" distribution. The vast majority of network flows occur within the first few seconds (0-2 seconds), with the frequency dropping precipitously as flow length increases. Because the Y-axis is logarithmic, small visual differences in bar height represent orders of magnitude in difference.
### Category-Specific Observations
1. **Short Duration (0-2 Seconds):**
* This is the only region where almost all categories are present.
* **Ransomware (Orange):** Highly concentrated at the 0-second mark with a frequency between $10^3$ and $10^4$.
* **Backdoor (Light Blue), Injection (Cyan), Scanning (Neon Green), DDoS (Blue), and XSS (Teal):** These are almost exclusively found in the 0-2 second range, appearing as thin slices in the very first bar.
* **Benign (Forest Green):** Reaches its peak frequency here, exceeding $10^7$.
2. **Mid-to-Long Duration (5-120 Seconds):**
* The distribution becomes dominated by three primary categories: **Benign** (Forest Green), **password** (Dark Olive Green), and **mitm** (Pink).
* **Password Attacks (Dark Olive Green):** Shows significant spikes at specific intervals, notably around 2-5 seconds, 25-30 seconds, and 60-65 seconds.
* **MITM (Pink):** Maintains a relatively consistent presence across the entire timeline, usually between $10^1$ and $10^2$ in frequency.
* **Benign (Forest Green):** Remains present throughout, often forming the "cap" of the bars, indicating that even for long durations, benign traffic is a constant factor.
3. **Anomalous Spikes:**
* There is a visible increase in frequency for **password** and **Benign** traffic at the 30-second and 60-second marks, suggesting periodic network behaviors or timeout-related events.
* A final uptick in frequency is observed at the 115-120 second mark, particularly for **Benign** and **mitm** traffic.
---
## 4. Structural Data Summary (Estimated)
| Flow Length (s) | Dominant Categories | Estimated Total Frequency |
| :--- | :--- | :--- |
| **0** | Benign, Scanning, DDoS, Backdoor, Ransomware | $> 10^7$ |
| **2-5** | Password, Benign, MITM | $\approx 10^4$ |
| **30** | Password, Benign | $\approx 10^4$ |
| **60** | Password, Benign, MITM | $\approx 10^3$ |
| **120** | Benign, MITM, Password | $\approx 10^3$ |
| **All others** | Benign, MITM, Password | $10^1$ to $10^2$ |
**Note on Language:** All text in the image is in English. No other languages were detected.