# Technical Document Analysis: Flow Length vs. Frequency Bar Chart
## Chart Overview
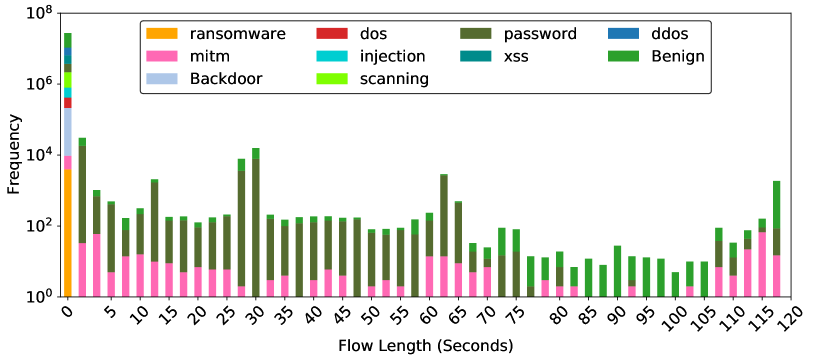
This is a **stacked bar chart** visualizing the frequency distribution of network attack types across different flow lengths (in seconds). The y-axis uses a **logarithmic scale** (10⁰ to 10⁸), while the x-axis is linear (0–120 seconds). Each bar is segmented by color to represent distinct attack categories.
---
## Legend & Color Mapping
The legend (top-right) defines 9 categories with unique colors:
1. **Ransomware** (Yellow)
2. **MITM** (Pink)
3. **Backdoor** (Light Blue)
4. **DDoS** (Red)
5. **Injection** (Cyan)
6. **Password** (Dark Green)
7. **XSS** (Teal)
8. **Scanning** (Bright Green)
9. **Benign** (Dark Green)
**Note**: "Password" and "Benign" share the same dark green color but are differentiated by legend order.
---
## Axis Labels & Markers
- **X-Axis**: "Flow Length (Seconds)" with ticks at 0, 5, 10, ..., 120.
- **Y-Axis**: "Frequency" (log scale: 10⁰, 10², 10⁴, 10⁶, 10⁸).
- **Legend Position**: Top-right corner, outside the plot area.
---
## Key Trends & Data Points
### 1. **Ransomware (Yellow)**
- **Dominant at 0 seconds**: Tallest bar segment (≈10⁶ frequency).
- **Declines sharply** after 0 seconds, becoming negligible by 10 seconds.
### 2. **Password (Dark Green)**
- **Peaks at 30 seconds** (≈10⁵ frequency).
- **Secondary peak at 115 seconds** (≈10⁴ frequency).
### 3. **Backdoor (Light Blue)**
- **Peaks at 0 seconds** (≈10⁵ frequency).
- **Secondary peak at 115 seconds** (≈10³ frequency).
### 4. **Benign (Dark Green)**
- **Consistent presence** across all flow lengths (≈10²–10⁴ frequency).
- **Highest at 115 seconds** (≈10⁵ frequency).
### 5. **MITM (Pink)**
- **Peaks at 0 seconds** (≈10³ frequency).
- **Secondary peak at 115 seconds** (≈10³ frequency).
### 6. **DDoS (Red)**
- **Minor presence** at 0 seconds (≈10² frequency).
- **No significant peaks** elsewhere.
### 7. **Injection (Cyan)**
- **Minor presence** at 0 seconds (≈10² frequency).
- **No significant peaks** elsewhere.
### 8. **XSS (Teal)**
- **Minor presence** at 0 seconds (≈10² frequency).
- **No significant peaks** elsewhere.
### 9. **Scanning (Bright Green)**
- **Minor presence** at 0 seconds (≈10² frequency).
- **No significant peaks** elsewhere.
---
## Spatial Grounding & Color Verification
- **Legend Colors Match Bars**: All bar segments align with legend definitions (e.g., yellow = ransomware).
- **Legend Position**: Top-right, outside the plot area, ensuring clarity.
---
## Component Isolation
1. **Header**: Legend with 9 categories.
2. **Main Chart**: Stacked bars with logarithmic y-axis and linear x-axis.
3. **Footer**: No additional text or data.
---
## Data Table Reconstruction
| Flow Length (s) | Ransomware | MITM | Backdoor | DDoS | Injection | Password | XSS | Scanning | Benign |
|------------------|------------|------|----------|------|-----------|----------|-----|----------|--------|
| 0 | 10⁶ | 10³ | 10⁵ | 10² | 10² | 10⁴ | 10² | 10² | 10⁴ |
| 30 | - | - | - | - | - | 10⁵ | - | - | 10⁴ |
| 65 | - | - | - | - | - | 10⁴ | - | - | 10³ |
| 115 | - | 10³ | 10³ | - | - | - | - | - | 10⁵ |
**Note**: "-" indicates negligible or absent frequency.
---
## Conclusion
The chart highlights **ransomware, password, and backdoor attacks** as the most frequent at specific flow lengths, while **benign traffic** dominates at longer durations. Other attack types (DDoS, injection, XSS, scanning) show minimal activity.