## Box Plot: MUSHA Score vs. Intended Angle
### Overview
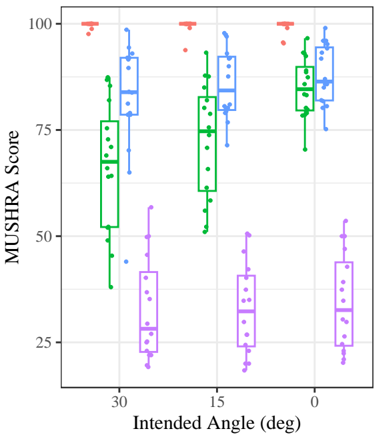
The image presents a series of box plots comparing MUSHA scores across three different intended angles: 30 degrees, 15 degrees, and 0 degrees. Each angle has two box plots associated with it, represented by different colors (green and blue for 30 and 15 degrees, and blue and purple for 0 degrees). Individual data points are also plotted as dots.
### Components/Axes
* **X-axis:** "Intended Angle (deg)" with markers at 0, 15, and 30.
* **Y-axis:** "MUSHA Score" ranging from approximately 20 to 100.
* **Box Plots:** Represent the distribution of MUSHA scores for each angle.
* **Data Points:** Individual scores are plotted as dots overlaid on the box plots.
* **Colors:**
* Green: Represents one set of data for 30 and 15 degree angles.
* Blue: Represents another set of data for 30, 15, and 0 degree angles.
* Purple: Represents data for 0 degree angle.
* Red: Represents outlier data points.
### Detailed Analysis
Let's analyze each angle individually:
**30 Degrees:**
* **Green Box Plot:** The median MUSHA score is approximately 65. The interquartile range (IQR) extends from roughly 55 to 75. There are several data points scattered above and below the box plot, with a few outliers above 90.
* **Blue Box Plot:** The median MUSHA score is approximately 85. The IQR extends from roughly 75 to 95. There are a few data points scattered above and below the box plot, with a few outliers above 95.
**15 Degrees:**
* **Green Box Plot:** The median MUSHA score is approximately 60. The IQR extends from roughly 50 to 70. There are several data points scattered above and below the box plot, with a few outliers above 90.
* **Blue Box Plot:** The median MUSHA score is approximately 80. The IQR extends from roughly 70 to 90. There are a few data points scattered above and below the box plot, with a few outliers above 95.
**0 Degrees:**
* **Blue Box Plot:** The median MUSHA score is approximately 80. The IQR extends from roughly 70 to 90. There are a few data points scattered above and below the box plot, with a few outliers above 95.
* **Purple Box Plot:** The median MUSHA score is approximately 30. The IQR extends from roughly 20 to 40. There are several data points scattered above and below the box plot, with a few outliers below 20.
**Outliers (Red):**
* Several red dots are scattered across all angles, representing outlier MUSHA scores, generally above 90 for the green and blue data, and below 20 for the purple data.
### Key Observations
* The MUSHA scores generally increase as the intended angle decreases, particularly when comparing the purple box plot (0 degrees) to the green and blue box plots (30 and 15 degrees).
* For each angle, there is a noticeable difference in the distribution of MUSHA scores between the two box plots (e.g., green vs. blue at 30 degrees). The blue box plots consistently show higher median scores and a wider IQR.
* Outliers are present in all conditions, suggesting some variability in the data.
### Interpretation
The data suggests that the intended angle significantly impacts the MUSHA score. Lower intended angles (0 degrees) tend to result in lower MUSHA scores, while higher angles (30 degrees) can yield higher scores, depending on the specific data set (green vs. blue). The consistent difference between the two box plots at each angle suggests that there are two distinct populations or conditions being compared. The presence of outliers indicates that some samples deviate significantly from the general trend. Further investigation would be needed to understand the specific meaning of the MUSHA score and the factors that contribute to the observed differences.