## Diagram: Network Topology
### Overview
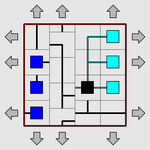
The image presents a diagram of a network topology, showing interconnected nodes and pathways within a grid-like structure. The diagram is enclosed within a red-brown border, and arrows around the perimeter suggest data flow or connectivity to external networks.
### Components/Axes
* **Nodes:** Represented by colored squares (blue, cyan, and black).
* **Connections:** Represented by black and teal lines indicating pathways between nodes.
* **Grid:** A light gray grid provides spatial organization.
* **Border:** A red-brown border encloses the network.
* **Arrows:** Gray arrows around the border indicate external connectivity or data flow.
### Detailed Analysis
* **Blue Nodes:** Three blue nodes are located on the left side of the grid, vertically aligned and connected by a black line.
* **Cyan Nodes:** Three cyan nodes are located on the right side of the grid, vertically aligned and connected to the central black node by teal lines.
* **Black Node:** A single black node is located in the center of the grid, acting as a central hub.
* **Connections:** The black lines connect the blue nodes to each other. The teal lines connect the black node to each of the cyan nodes.
* **External Connectivity:** Gray arrows point inward and outward from all sides of the red-brown border, suggesting bidirectional data flow or connections to external networks.
### Key Observations
* The network appears to have a centralized architecture, with the black node acting as a central hub.
* The blue nodes on the left seem to be input nodes, while the cyan nodes on the right seem to be output nodes.
* The arrows around the border suggest that the network is connected to other networks or systems.
### Interpretation
The diagram illustrates a basic network topology with a central hub connecting input and output nodes. The arrows indicate that this network is part of a larger system or network. The specific function of each node is not clear from the diagram, but the arrangement suggests a data processing or distribution system. The diagram could represent a simplified model of a computer network, a sensor network, or any other system where data flows between interconnected nodes.