## Diagram: Grid-Based Flow System with Colored Nodes
### Overview
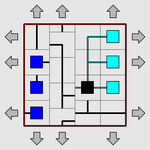
The image depicts a grid-based system with directional arrows and colored nodes. The grid is divided into a 3x3 layout with a central black square, three blue squares on the left, and three cyan squares on the right. Arrows surround the grid (pointing inward) and connect nodes within the grid, suggesting a flow or processing pathway.
### Components/Axes
- **Grid Structure**:
- 3x3 grid with a red border.
- Nodes:
- **Blue Squares**: 3 nodes on the left column (positions: top-left, middle-left, bottom-left).
- **Black Square**: 1 node at the center (position: middle-center).
- **Cyan Squares**: 3 nodes on the right column (positions: top-right, middle-right, bottom-right).
- **Arrows**:
- **External Arrows**: 8 gray arrows around the grid (top, bottom, left, right edges), all pointing inward.
- **Internal Arrows**: Black lines connecting nodes (e.g., blue → black → cyan).
### Detailed Analysis
- **Node Connections**:
- Blue nodes (left) connect to the black node (center) via black lines.
- Black node connects to cyan nodes (right) via black lines.
- No direct connections between blue and cyan nodes.
- **Directionality**:
- External arrows enforce unidirectional flow into the grid.
- Internal arrows suggest sequential processing: inputs (blue) → processing (black) → outputs (cyan).
- **Color Coding**:
- Blue: Input sources.
- Black: Central processing unit.
- Cyan: Output destinations.
### Key Observations
1. **Flow Path**: Data/processes move from blue nodes → black node → cyan nodes.
2. **Symmetry**: Blue and cyan nodes are symmetrically placed but serve distinct roles.
3. **No Text/Legend**: No labels, axis titles, or legends are present in the image.
### Interpretation
This diagram likely represents a **data flow architecture** or **process workflow**:
- **Inputs** (blue nodes) feed into a **central processor** (black node), which then routes outputs to **destinations** (cyan nodes).
- The absence of feedback loops (no arrows pointing outward from cyan nodes) suggests a linear, one-way process.
- The grid structure implies modularity, with each node potentially representing a discrete component in a larger system.
**Notable Patterns**:
- The black node acts as a bottleneck, centralizing control.
- Symmetry in node placement may indicate balanced input/output distribution.
**Underlying Implications**:
- Could model systems like data pipelines, manufacturing workflows, or decision-making processes.
- The lack of feedback loops limits adaptability but ensures predictability.
**Note**: The image contains no textual data, numerical values, or explicit legends. All interpretations are based on visual structure and spatial relationships.