## Line Chart: Model Performance Comparison
### Overview
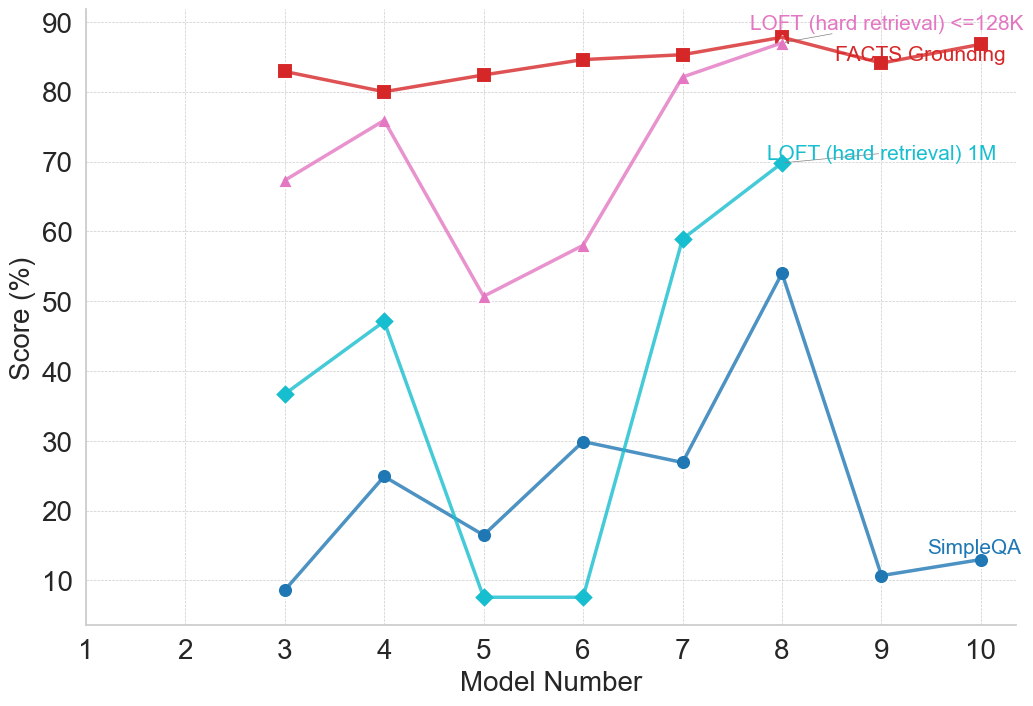
The image is a line chart comparing the performance of four different models (LOFT with hard retrieval <=128K, FACTS Grounding, LOFT with hard retrieval 1M, and SimpleQA) across a range of model numbers (1 to 10). The y-axis represents the score in percentage, ranging from 0 to 90.
### Components/Axes
* **X-axis:** Model Number (ranging from 1 to 10)
* **Y-axis:** Score (%) (ranging from 0 to 90)
* **Legend (top-right):**
* Red squares: LOFT (hard retrieval) <=128K
* Pink triangles: FACTS Grounding
* Teal diamonds: LOFT (hard retrieval) 1M
* Blue circles: SimpleQA
### Detailed Analysis
* **LOFT (hard retrieval) <=128K (Red Squares):**
* Trend: Relatively stable and high-performing.
* Model 3: ~83%
* Model 4: ~83%
* Model 5: ~82%
* Model 6: ~85%
* Model 7: ~86%
* Model 8: ~87%
* Model 9: Not present
* Model 10: Not present
* **FACTS Grounding (Pink Triangles):**
* Trend: Starts lower, peaks at Model 4, then decreases, and increases again.
* Model 3: ~67%
* Model 4: ~76%
* Model 5: ~50%
* Model 6: ~58%
* Model 7: ~59%
* Model 8: Not present
* Model 9: Not present
* Model 10: Not present
* **LOFT (hard retrieval) 1M (Teal Diamonds):**
* Trend: Starts low, peaks at Model 4, then decreases sharply, and increases again.
* Model 3: ~37%
* Model 4: ~47%
* Model 5: ~17%
* Model 6: ~8%
* Model 7: ~59%
* Model 8: ~70%
* Model 9: Not present
* Model 10: Not present
* **SimpleQA (Blue Circles):**
* Trend: Low performance with a peak at Model 4, then decreases sharply, and increases slightly.
* Model 3: ~9%
* Model 4: ~25%
* Model 5: ~17%
* Model 6: ~8%
* Model 7: ~27%
* Model 8: ~30%
* Model 9: ~11%
* Model 10: ~12%
### Key Observations
* LOFT (hard retrieval) <=128K consistently outperforms the other models.
* SimpleQA consistently underperforms the other models.
* LOFT (hard retrieval) 1M and FACTS Grounding show more variability in performance across different model numbers.
* All models are only plotted up to Model Number 10.
### Interpretation
The chart provides a comparative analysis of the performance of four different models. LOFT (hard retrieval) <=128K appears to be the most robust and reliable model based on the data presented. SimpleQA consistently shows the lowest scores, indicating it may need further refinement or is not well-suited for the task being evaluated. The variability in performance of FACTS Grounding and LOFT (hard retrieval) 1M suggests that their effectiveness may be more dependent on the specific characteristics of each model number. The absence of data points for models 8, 9, and 10 for LOFT (hard retrieval) <=128K, FACTS Grounding, and LOFT (hard retrieval) 1M suggests that these models may not have been evaluated for those specific model numbers.