TECHNICAL ASSET FINGERPRINT
75b50b6d37dfc0bfb21b79bf
Click to view fullscreen
Press ESC or click to close
FOUND IN PAPERS
EXPERT: gemini-3.1-pro-preview VERSION 1
RUNTIME: gemini/gemini-3.1-pro-preview
INTEL_VERIFIED
## Line Chart: Model Performance Scores Across Different Benchmarks
### Overview
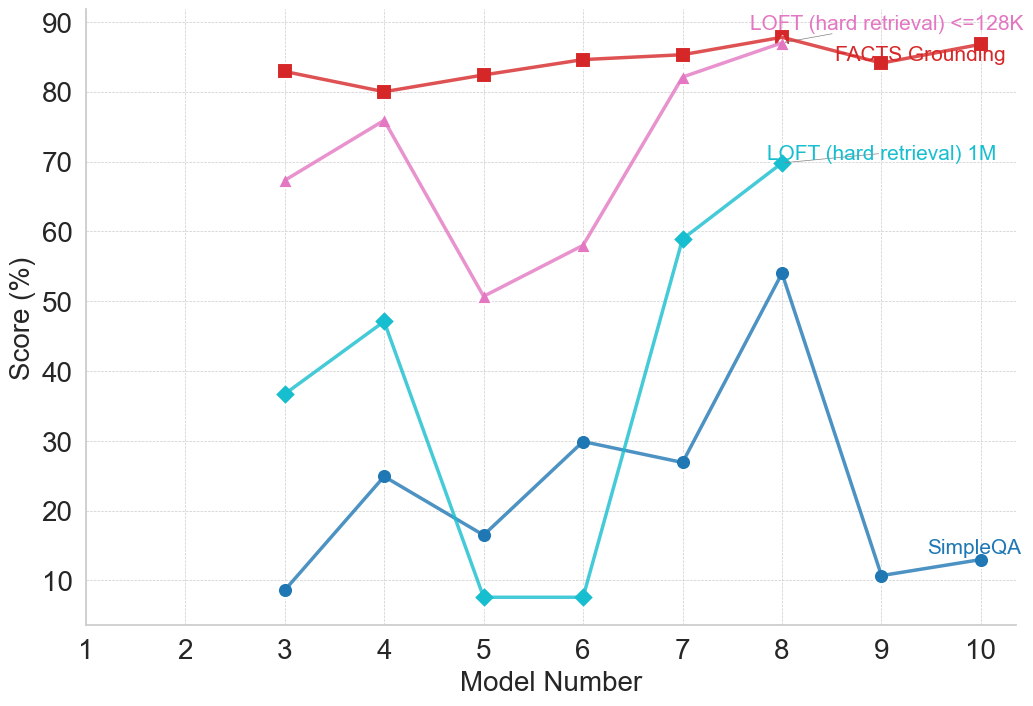
This image is a line chart displaying the performance scores (in percentages) of various numbered models across four different evaluation benchmarks. The chart illustrates how performance varies significantly depending on the specific task, with some models showing extreme volatility in certain long-context retrieval tasks, while maintaining high stability in fact-grounding tasks. Note that data is only plotted for models 3 through 10.
### Components/Axes
**Spatial Grounding & Layout:**
* **Main Chart Area:** Occupies the majority of the image, featuring a white background with a light gray grid. Horizontal gridlines are dashed (every 10 units), and vertical gridlines are dotted (every 1 unit).
* **X-Axis (Bottom):** Labeled **"Model Number"**. The scale runs from 1 to 10, with major tick marks and labels at every integer (1, 2, 3, 4, 5, 6, 7, 8, 9, 10).
* **Y-Axis (Left):** Labeled **"Score (%)"**. The scale runs from 10 to 90, with major tick marks and labels at increments of 10 (10, 20, 30, 40, 50, 60, 70, 80, 90).
* **Legend/Labels:** There is no standalone legend box. Instead, labels are placed directly within the chart area, adjacent to or pointing toward their respective data lines.
* *Top-Right (Pink text):* **"LOFT (hard retrieval) <=128K"** (Points via a thin gray line to the pink triangle at x=8).
* *Top-Right (Red text):* **"FACTS Grounding"** (Placed directly over the red line between x=8 and x=10).
* *Middle-Right (Teal text):* **"LOFT (hard retrieval) 1M"** (Points via a thin gray line to the teal diamond at x=8).
* *Bottom-Right (Dark Blue text):* **"SimpleQA"** (Placed just above the dark blue line at x=10).
### Detailed Analysis
*Note: All numerical values are visual approximations extracted from the chart.*
**1. FACTS Grounding (Red line, Square markers)**
* *Trend Verification:* This line represents the highest overall scores on the chart. It slopes slightly downward from model 3 to 4, then exhibits a steady, gradual upward trend through model 8, dips slightly at model 9, and rises again at model 10. It is the most stable metric.
* *Data Points:*
* Model 3: ~83%
* Model 4: ~80%
* Model 5: ~82.5%
* Model 6: ~84.5%
* Model 7: ~85.5%
* Model 8: ~88% (Peak)
* Model 9: ~84%
* Model 10: ~87%
**2. LOFT (hard retrieval) <=128K (Pink line, Upward-pointing Triangle markers)**
* *Trend Verification:* This series shows significant volatility. It slopes upward from model 3 to 4, experiences a sharp decline at model 5, and then climbs steeply and consistently to peak at model 8, where it nearly converges with the FACTS Grounding line. This series terminates at model 8.
* *Data Points:*
* Model 3: ~67%
* Model 4: ~76%
* Model 5: ~51% (Local minimum)
* Model 6: ~58%
* Model 7: ~82%
* Model 8: ~87% (Peak)
* Models 9 & 10: No data plotted.
**3. LOFT (hard retrieval) 1M (Teal line, Diamond markers)**
* *Trend Verification:* This is the most volatile series. It slopes upward from model 3 to 4, then crashes dramatically to near-zero scores for models 5 and 6. It then exhibits a massive recovery, spiking sharply upward through models 7 and 8. This series also terminates at model 8.
* *Data Points:*
* Model 3: ~37%
* Model 4: ~47%
* Model 5: ~7.5% (Trough)
* Model 6: ~7.5% (Trough)
* Model 7: ~59%
* Model 8: ~70% (Peak)
* Models 9 & 10: No data plotted.
**4. SimpleQA (Dark Blue line, Circle markers)**
* *Trend Verification:* This series generally occupies the lowest scoring tier. It is highly erratic, zigzagging up and down. It peaks significantly at model 8, but then crashes to its lowest points for models 9 and 10.
* *Data Points:*
* Model 3: ~9%
* Model 4: ~25%
* Model 5: ~16.5%
* Model 6: ~30%
* Model 7: ~27%
* Model 8: ~54% (Peak)
* Model 9: ~10.5%
* Model 10: ~13%
### Key Observations
* **Missing Data:** Models 1 and 2 have no data points for any metric. Furthermore, the two "LOFT" metrics abruptly end at Model 8, while FACTS Grounding and SimpleQA continue to Model 10.
* **The "Model 8" Anomaly:** Model 8 represents a universal peak. Every single metric evaluated reaches its highest score at Model 8.
* **The "Model 5/6" Collapse:** Models 5 and 6 struggle significantly with the "LOFT" retrieval tasks, particularly the 1M context window, which drops to single digits.
* **Context Window Difficulty:** Comparing the two LOFT metrics, the 1M (1 million) context window is consistently and significantly harder for the models to process than the <=128K context window, evidenced by the teal line always remaining below the pink line.
* **Task Disparity:** "FACTS Grounding" is clearly the easiest task for these models (or the models are specifically optimized for it), consistently scoring in the 80%+ range. Conversely, "SimpleQA" yields very poor results, mostly staying below 30%, except for the spike at Model 8.
### Interpretation
Reading between the lines, this chart likely represents an evaluation of a specific family of Large Language Models (LLMs), where the "Model Number" corresponds to different iterations, sizes, or training checkpoints (e.g., Model 3 might be a 7B parameter model, while Model 8 might be a 70B parameter model).
The data suggests that **Model 8 is the most capable model** in this lineup, showing strong competence across all tasks, including a massive improvement in the difficult SimpleQA benchmark.
The severe crash of the LOFT 1M metric at Models 5 and 6 indicates a critical failure in long-context retrieval for those specific architectures or checkpoints. They completely lose the ability to find information in a 1-million-token haystack, whereas Model 4 and Model 7 handle it much better.
The absence of LOFT data for Models 9 and 10 suggests one of two things: either those models do not support context windows large enough to run the LOFT benchmarks (meaning they are limited to less than 128k tokens), or the researchers simply did not run/finish those specific evaluations before generating the chart.
Finally, the vast gap between "FACTS Grounding" (high) and "SimpleQA" (low) implies a definitional difference in the benchmarks. "FACTS Grounding" might provide the model with the text to ground its answers in (making it an easier reading comprehension task), whereas "SimpleQA" might require the model to rely solely on its internal parametric memory, which these models clearly struggle with.
DECODING INTELLIGENCE...