## Line Chart: Model Performance Comparison
### Overview
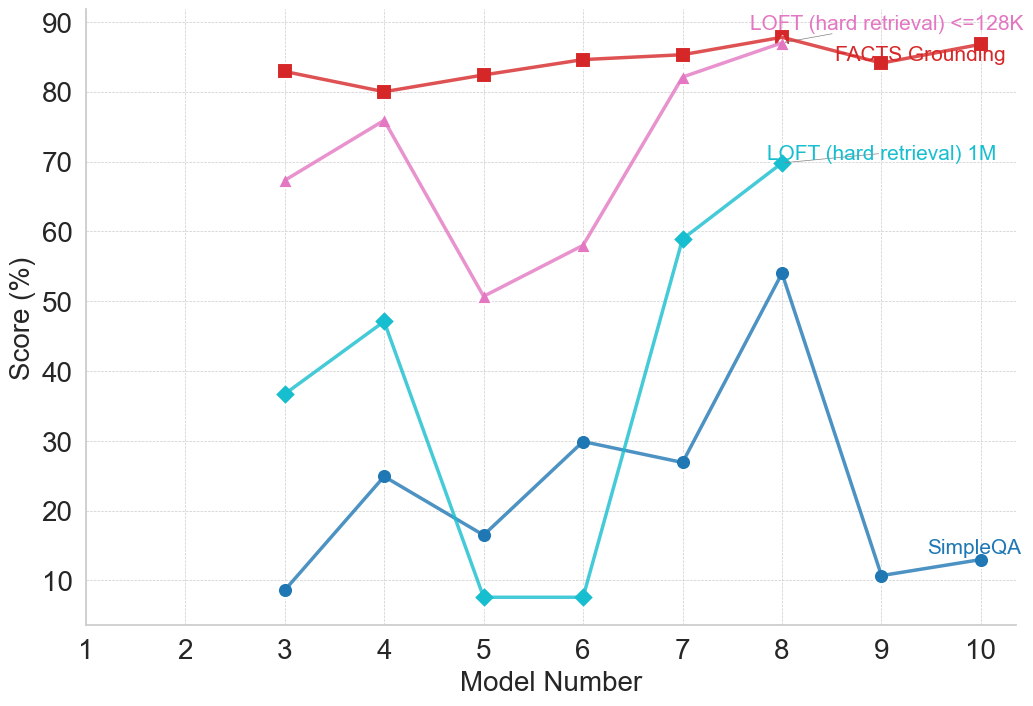
This line chart compares the performance scores of three different models (LOFT with <=128K retrieval, LOFT with 1M retrieval, and SimpleQA) across ten different model numbers. The performance is measured as a percentage score.
### Components/Axes
* **X-axis:** Model Number (ranging from 1 to 10)
* **Y-axis:** Score (%) (ranging from 0 to 90)
* **Lines/Legends:**
* LOFT (hard retrieval) <=128K (represented by a red line with square markers)
* LOFT (hard retrieval) 1M (represented by a teal line with circular markers)
* SimpleQA (represented by a blue line with diamond markers)
* **Annotation:** "FACTS Grounding" is written in red text near the red line around Model Number 8.
### Detailed Analysis
**LOFT (hard retrieval) <=128K (Red Line):**
The red line generally trends horizontally, indicating relatively stable performance.
* Model 1: Approximately 82%
* Model 2: Approximately 82%
* Model 3: Approximately 79%
* Model 4: Approximately 78%
* Model 5: Approximately 80%
* Model 6: Approximately 81%
* Model 7: Approximately 85%
* Model 8: Approximately 85%
* Model 9: Approximately 83%
* Model 10: Approximately 82%
**LOFT (hard retrieval) 1M (Teal Line):**
The teal line exhibits a more fluctuating pattern.
* Model 1: Approximately 10%
* Model 2: Approximately 10%
* Model 3: Approximately 68%
* Model 4: Approximately 48%
* Model 5: Approximately 13%
* Model 6: Approximately 55%
* Model 7: Approximately 60%
* Model 8: Approximately 56%
* Model 9: Approximately 52%
* Model 10: Approximately 12%
**SimpleQA (Blue Line):**
The blue line shows a decreasing trend overall.
* Model 1: Approximately 10%
* Model 2: Approximately 10%
* Model 3: Approximately 10%
* Model 4: Approximately 22%
* Model 5: Approximately 13%
* Model 6: Approximately 30%
* Model 7: Approximately 26%
* Model 8: Approximately 56%
* Model 9: Approximately 12%
* Model 10: Approximately 10%
### Key Observations
* LOFT (<=128K) consistently outperforms the other two models across most model numbers, maintaining a high score around 80-85%.
* LOFT (1M) shows significant variability in performance, with a large jump at Model 3, and fluctuations throughout.
* SimpleQA starts with a low score and shows some improvement up to Model 8, but then declines sharply.
* The annotation "FACTS Grounding" suggests that the performance of LOFT (<=128K) around Model 8 might be related to the use of FACTS grounding.
### Interpretation
The data suggests that the LOFT model with <=128K retrieval is the most stable and reliable performer across the tested model numbers. The 1M retrieval version of LOFT shows potential but is more sensitive to changes in the model number. SimpleQA demonstrates limited performance and a declining trend. The annotation indicates that incorporating "FACTS Grounding" may contribute to the high performance of the LOFT (<=128K) model. The large performance swing in LOFT (1M) could be due to the increased complexity of retrieving and processing information from a larger knowledge base (1M vs. 128K). The decline in SimpleQA's performance towards the end could indicate overfitting or a limitation in its ability to generalize to different model configurations. The chart highlights the importance of retrieval size and grounding techniques in achieving robust performance in these models.