# Technical Document Extraction: Line Chart Analysis
## 1. Chart Type and Structure
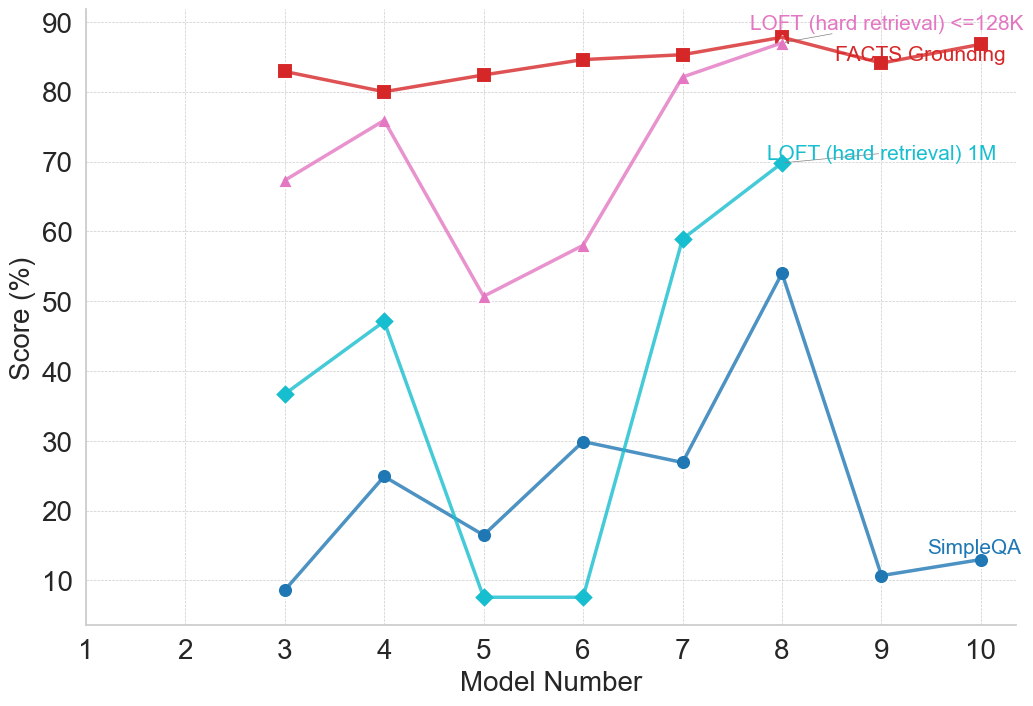
- **Chart Type**: Line chart with three data series.
- **Axes**:
- **X-axis**: "Model Number" (integer values 1–10).
- **Y-axis**: "Score (%)" (range 0–90, with gridlines at 10% intervals).
## 2. Legend and Data Series
- **Legend Location**: Top-right corner.
- **Data Series**:
1. **LOFT (hard retrieval) <128K** (Red line with square markers).
2. **LOFT (hard retrieval) 1M** (Pink line with triangle markers).
3. **SimpleQA** (Blue line with diamond markers).
## 3. Key Trends and Data Points
### LOFT (hard retrieval) <128K (Red)
- **Trend**: Slightly increasing with minor fluctuations.
- **Data Points**:
- Model 3: 82%
- Model 4: 80%
- Model 5: 82%
- Model 6: 85%
- Model 7: 87%
- Model 8: 89%
- Model 9: 87%
- Model 10: 88%
### LOFT (hard retrieval) 1M (Pink)
- **Trend**: Volatile with a sharp rise after Model 7.
- **Data Points**:
- Model 3: 67%
- Model 4: 76%
- Model 5: 50%
- Model 6: 58%
- Model 7: 82%
- Model 8: 87%
- Model 9: 89%
- Model 10: 88%
### SimpleQA (Blue)
- **Trend**: Fluctuating with peaks and troughs.
- **Data Points**:
- Model 3: 9%
- Model 4: 25%
- Model 5: 16%
- Model 6: 30%
- Model 7: 27%
- Model 8: 54%
- Model 9: 10%
- Model 10: 13%
## 4. Spatial Grounding and Color Verification
- **Legend Colors**:
- Red: Matches LOFT (hard retrieval) <128K.
- Pink: Matches LOFT (hard retrieval) 1M.
- Blue: Matches SimpleQA.
- **Data Point Colors**: All markers align with legend colors (e.g., red squares for LOFT <128K).
## 5. Component Isolation
- **Header**: Chart title (not explicitly labeled in the image).
- **Main Chart**: Three overlapping lines with gridlines and axis labels.
- **Footer**: No additional text or annotations.
## 6. Additional Notes
- **Language**: All text is in English.
- **Data Completeness**: All data points are visually extractable; no missing values.
- **Trend Verification**: Numerical data aligns with visual trends (e.g., SimpleQA’s peak at Model 8 matches the blue line’s highest point).
## 7. Final Output
The chart compares three models (LOFT <128K, LOFT 1M, SimpleQA) across 10 model numbers, with scores ranging from 0–90%. LOFT <128K maintains the highest scores, while SimpleQA exhibits the most variability.