## Line Chart: Model Accuracy vs. Number of Interactions
### Overview
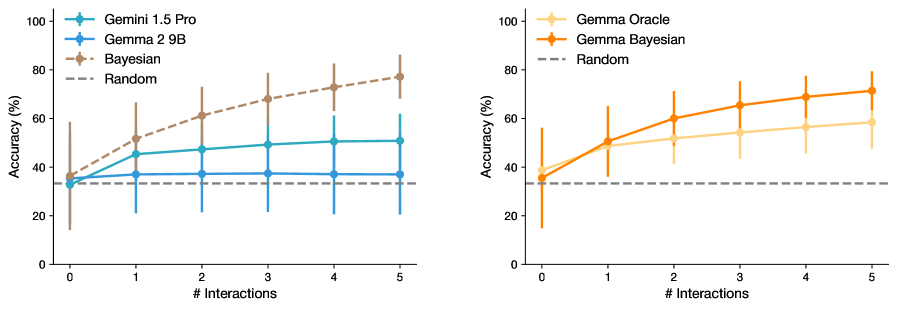
The image contains two line charts comparing the accuracy of different language models as the number of interactions increases. The left chart compares "Gemini 1.5 Pro", "Gemma 2 9B", and "Bayesian" models, while the right chart compares "Gemma Oracle" and "Gemma Bayesian" models. Both charts include a "Random" baseline. The x-axis represents the number of interactions, and the y-axis represents the accuracy in percentage. Error bars are present on each data point.
### Components/Axes
* **X-axis (Horizontal):** "# Interactions" ranging from 0 to 5.
* **Y-axis (Vertical):** "Accuracy (%)" ranging from 0 to 100.
* **Left Chart Legend (Top-Left):**
* Blue: Gemini 1.5 Pro
* Light Blue: Gemma 2 9B
* Brown Dashed: Bayesian
* Gray Dashed: Random
* **Right Chart Legend (Top-Right):**
* Light Orange: Gemma Oracle
* Orange: Gemma Bayesian
* Gray Dashed: Random
* **Horizontal Dashed Line:** Represents the "Random" baseline, positioned at approximately 33% accuracy on both charts.
### Detailed Analysis
**Left Chart:**
* **Gemini 1.5 Pro (Blue):** Starts at approximately 33% accuracy at 0 interactions, increases to approximately 45% at 1 interaction, and then plateaus around 48-50% for 2-5 interactions.
* (0, 33%), (1, 45%), (2, 48%), (3, 48%), (4, 50%), (5, 50%)
* **Gemma 2 9B (Light Blue):** Starts at approximately 33% accuracy at 0 interactions, increases to approximately 37% at 1 interaction, and then plateaus around 37% for 2-5 interactions.
* (0, 33%), (1, 37%), (2, 37%), (3, 37%), (4, 37%), (5, 37%)
* **Bayesian (Brown Dashed):** Starts at approximately 37% accuracy at 0 interactions and increases steadily to approximately 77% at 5 interactions.
* (0, 37%), (1, 50%), (2, 60%), (3, 65%), (4, 70%), (5, 77%)
* **Random (Gray Dashed):** Remains constant at approximately 33% accuracy across all interactions.
**Right Chart:**
* **Gemma Oracle (Light Orange):** Starts at approximately 37% accuracy at 0 interactions, increases to approximately 50% at 1 interaction, and then plateaus around 55-58% for 2-5 interactions.
* (0, 37%), (1, 50%), (2, 53%), (3, 55%), (4, 57%), (5, 58%)
* **Gemma Bayesian (Orange):** Starts at approximately 37% accuracy at 0 interactions, increases to approximately 50% at 1 interaction, and then continues to increase to approximately 72% at 5 interactions.
* (0, 37%), (1, 50%), (2, 60%), (3, 67%), (4, 70%), (5, 72%)
* **Random (Gray Dashed):** Remains constant at approximately 33% accuracy across all interactions.
### Key Observations
* The "Random" baseline remains constant across all interactions in both charts.
* In the left chart, the "Bayesian" model shows the most significant improvement in accuracy as the number of interactions increases.
* In the right chart, the "Gemma Bayesian" model shows a more significant improvement in accuracy compared to "Gemma Oracle" as the number of interactions increases.
* "Gemini 1.5 Pro" and "Gemma 2 9B" plateau quickly after the first interaction.
### Interpretation
The charts illustrate how the accuracy of different language models changes with an increasing number of interactions. The "Bayesian" model in the left chart and the "Gemma Bayesian" model in the right chart demonstrate the most substantial improvements in accuracy, suggesting that these models benefit more from increased interactions compared to the other models. The "Random" baseline serves as a control, indicating the expected accuracy without any learning or interaction. The error bars indicate the variability in the accuracy measurements. The plateauing of "Gemini 1.5 Pro", "Gemma 2 9B", and "Gemma Oracle" suggests that these models may have reached a performance limit with the given interaction setup.