\n
## Line Chart: Accuracy vs. Number of Interactions for Language Models
### Overview
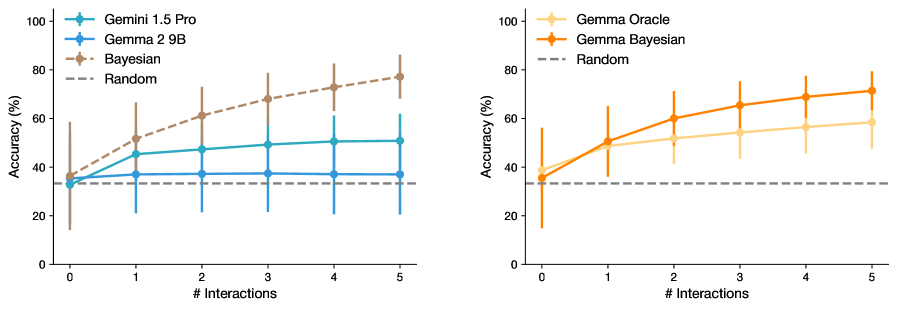
The image presents two line charts comparing the accuracy of different language models (Gemini 1.5 Pro, Gemma 2 9B, Gemma Oracle, and Bayesian) against a random baseline, as a function of the number of interactions. Both charts share the same x-axis representing the number of interactions, ranging from 0 to 5. The y-axis represents accuracy in percentage, ranging from 0 to 100. Error bars are included for each data point, indicating the variability in accuracy.
### Components/Axes
* **X-axis:** "# Interactions" (Number of Interactions) - Scale: 0, 1, 2, 3, 4, 5
* **Y-axis:** "Accuracy (%)" (Accuracy in Percentage) - Scale: 0, 20, 40, 60, 80, 100
* **Left Chart Legend:**
* Gemini 1.5 Pro (Blue)
* Gemma 2 9B (Light Blue)
* Bayesian (Gray)
* Random (Gray Dashed)
* **Right Chart Legend:**
* Gemma Oracle (Orange)
* Gemma Bayesian (Light Orange)
* Random (Gray Dashed)
### Detailed Analysis or Content Details
**Left Chart: Gemini 1.5 Pro, Gemma 2 9B, Bayesian vs. Random**
* **Gemini 1.5 Pro (Blue):** The line is relatively flat, starting at approximately 38% accuracy at 0 interactions. It increases to around 48% at 1 interaction, plateaus around 52% between 2 and 4 interactions, and then slightly decreases to approximately 50% at 5 interactions. Error bars are consistently around +/- 8%.
* **Gemma 2 9B (Light Blue):** Starts at approximately 34% accuracy at 0 interactions. It increases to around 42% at 1 interaction, then plateaus around 45% between 2 and 5 interactions. Error bars are consistently around +/- 10%.
* **Bayesian (Gray):** Starts at approximately 32% accuracy at 0 interactions. It increases steadily to around 42% at 1 interaction, then continues to increase to approximately 50% at 3 interactions, and finally reaches around 55% at 5 interactions. Error bars are consistently around +/- 10%.
* **Random (Gray Dashed):** A horizontal line at approximately 32% accuracy across all interaction levels. Error bars are consistently around +/- 10%.
**Right Chart: Gemma Oracle, Gemma Bayesian vs. Random**
* **Gemma Oracle (Orange):** Starts at approximately 34% accuracy at 0 interactions. It increases steadily to around 48% at 1 interaction, then continues to increase to approximately 62% at 3 interactions, and finally reaches around 72% at 5 interactions. Error bars are consistently around +/- 10%.
* **Gemma Bayesian (Light Orange):** Starts at approximately 34% accuracy at 0 interactions. It increases steadily to around 48% at 1 interaction, then continues to increase to approximately 60% at 3 interactions, and finally reaches around 70% at 5 interactions. Error bars are consistently around +/- 10%.
* **Random (Gray Dashed):** A horizontal line at approximately 32% accuracy across all interaction levels. Error bars are consistently around +/- 10%.
### Key Observations
* In the left chart, Gemini 1.5 Pro and Gemma 2 9B show limited improvement in accuracy with increasing interactions, remaining relatively stable after the initial increase. Bayesian shows a more consistent increase in accuracy with more interactions.
* In the right chart, both Gemma Oracle and Gemma Bayesian demonstrate a clear positive correlation between the number of interactions and accuracy, with a significant increase observed as the number of interactions grows.
* All models consistently outperform the random baseline.
* The error bars suggest a considerable degree of variability in the accuracy measurements for all models.
### Interpretation
The data suggests that the benefit of increased interactions varies significantly between different language models. Gemini 1.5 Pro and Gemma 2 9B appear to reach a performance plateau relatively quickly, indicating that additional interactions do not substantially improve their accuracy. In contrast, Bayesian, Gemma Oracle, and Gemma Bayesian demonstrate a more sustained improvement in accuracy with increasing interactions, suggesting that these models are better able to leverage additional information or refine their responses through iterative interaction.
The consistent outperformance of all models compared to the random baseline indicates that these models possess some level of inherent understanding or ability to learn from the interaction process. The error bars highlight the inherent uncertainty in evaluating language model performance and suggest that the observed differences in accuracy may not always be statistically significant.
The two charts provide a comparative analysis of different model architectures and their responsiveness to iterative interaction. The results could inform the design of interaction strategies for language models, suggesting that for some models, focusing on more efficient initial interactions may be more beneficial than simply increasing the number of interactions.