## Line Charts: Model Accuracy vs. Number of Interactions
### Overview
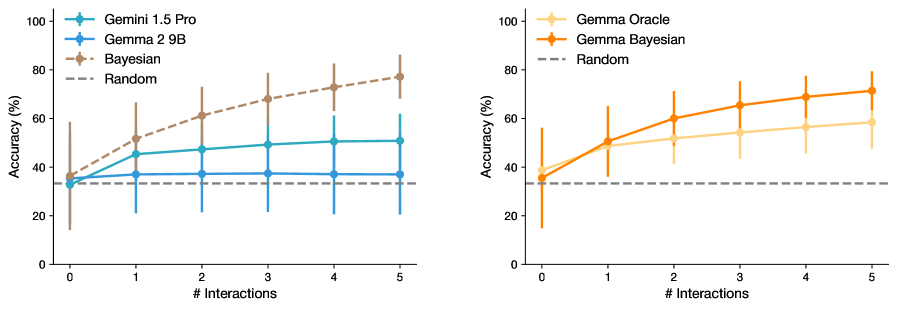
The image contains two side-by-side line charts comparing the accuracy of different machine learning models as a function of interaction count. Both charts use percentage accuracy on the y-axis (0-100%) and interaction count (0-5) on the x-axis. The left chart compares Gemini 1.5 Pro, Gemma 2 9B, Bayesian, and Random models. The right chart compares Gamma Oracle, Gamma Bayesian, and Random models.
### Components/Axes
**Left Chart:**
- **X-axis**: "# Interactions" (0-5, integer scale)
- **Y-axis**: "Accuracy (%)" (0-100%, linear scale)
- **Legend**: Top-left corner with four entries:
- Green: Gemini 1.5 Pro
- Blue: Gemma 2 9B
- Brown: Bayesian
- Gray: Random
- **Lines**: Four distinct colored lines with error bars
**Right Chart:**
- **X-axis**: "# Interactions" (0-5, integer scale)
- **Y-axis**: "Accuracy (%)" (0-100%, linear scale)
- **Legend**: Top-left corner with three entries:
- Orange: Gamma Oracle
- Red: Gamma Bayesian
- Gray: Random
- **Lines**: Three distinct colored lines with error bars
### Detailed Analysis
**Left Chart Trends:**
1. **Gemini 1.5 Pro** (Green): Starts at ~30% accuracy at 0 interactions, increases steadily to ~50% by 5 interactions (error bars ±5-10%)
2. **Gemma 2 9B** (Blue): Remains flat at ~35% accuracy across all interactions (error bars ±5%)
3. **Bayesian** (Brown): Starts at ~35%, rises sharply to ~75% by 5 interactions (error bars ±5-15%)
4. **Random** (Gray): Flat line at ~30% accuracy (error bars ±3%)
**Right Chart Trends:**
1. **Gamma Oracle** (Orange): Starts at ~35%, increases to ~55% by 5 interactions (error bars ±5-10%)
2. **Gamma Bayesian** (Red): Starts at ~30%, rises to ~70% by 5 interactions (error bars ±5-15%)
3. **Random** (Gray): Flat line at ~30% accuracy (error bars ±3%)
### Key Observations
1. **Interaction-Dependent Performance**: Both Bayesian models (Bayesian and Gamma Bayesian) show significant accuracy improvements with more interactions, while non-Bayesian models plateau early.
2. **Error Bar Patterns**: Bayesian models exhibit larger error bars, suggesting greater variability in performance across trials.
3. **Random Baseline**: The Random model maintains consistent performance across both charts, serving as a performance floor.
4. **Model Divergence**: The Gamma Bayesian model outperforms Gamma Oracle by ~15% at 5 interactions despite similar starting points.
### Interpretation
The data suggests that Bayesian modeling frameworks (Bayesian and Gamma Bayesian) demonstrate superior adaptability to increased interaction data, achieving ~40-50% higher accuracy than non-Bayesian models at maximum interactions. This implies that Bayesian methods may be particularly effective for incremental learning scenarios where models receive sequential data inputs. The consistent performance of Random models across both charts indicates that the observed improvements are not due to baseline model architecture differences but rather to the interaction data volume and model architecture choices. The larger error bars for Bayesian models warrant further investigation into their stability under varying conditions.