\n
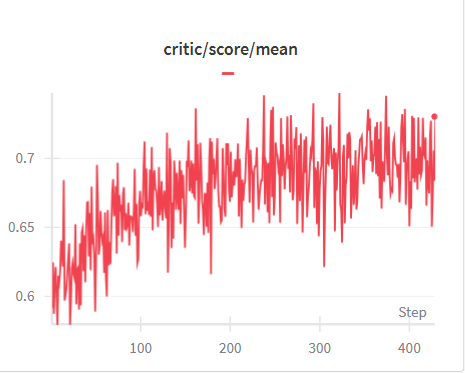
## Line Chart: Critic Score Mean Over Steps
### Overview
The image displays a line chart illustrating the mean critic score over a series of steps. The chart shows a fluctuating trend, generally increasing over time, with significant volatility.
### Components/Axes
* **Title:** "critic/score/mean" with a horizontal line underneath.
* **X-axis:** Labeled "Step". The scale ranges from approximately 0 to 450, with tick marks at 0, 100, 200, 300, and 400.
* **Y-axis:** No explicit label, but represents the mean critic score. The scale ranges from approximately 0.60 to 0.75, with tick marks at 0.60, 0.65, 0.70, and 0.75.
* **Data Series:** A single red line representing the mean critic score.
### Detailed Analysis
The red line begins at approximately 0.61 at Step 0. The line generally trends upwards, but with substantial fluctuations.
* **0-100 Steps:** The line exhibits high volatility, increasing from 0.61 to approximately 0.68.
* **100-200 Steps:** The line continues to increase, reaching a peak of around 0.72 at Step 150, then fluctuating between 0.68 and 0.72.
* **200-300 Steps:** The line remains volatile, oscillating between approximately 0.66 and 0.73.
* **300-400 Steps:** The line shows a slight upward trend, with fluctuations between 0.68 and 0.74.
* **400-450 Steps:** The line increases to a final value of approximately 0.74.
It's difficult to provide precise values due to the density of the line and the lack of a grid. The values are approximate based on visual estimation.
### Key Observations
* The mean critic score generally increases over the 450 steps.
* The score is highly volatile, with frequent and significant fluctuations.
* There are no clear, sustained periods of increase or decrease, only oscillations around an upward trend.
* The final score at Step 450 is approximately 0.74, significantly higher than the initial score at Step 0.
### Interpretation
The chart suggests that the critic score, while fluctuating, is generally improving over time. The high volatility indicates that the score is sensitive to changes or events occurring at each step. The upward trend suggests a positive overall trajectory, but the fluctuations imply that the improvement is not consistent. This could represent a learning process, where initial scores are lower and more variable, but gradually converge towards a higher mean as the process matures. The data does not provide information about *why* the score is changing, only *that* it is changing. Further investigation would be needed to understand the factors driving the fluctuations and the overall trend.