## Chart/Diagram Type: Inequality Graph and Solution Explanation
### Overview
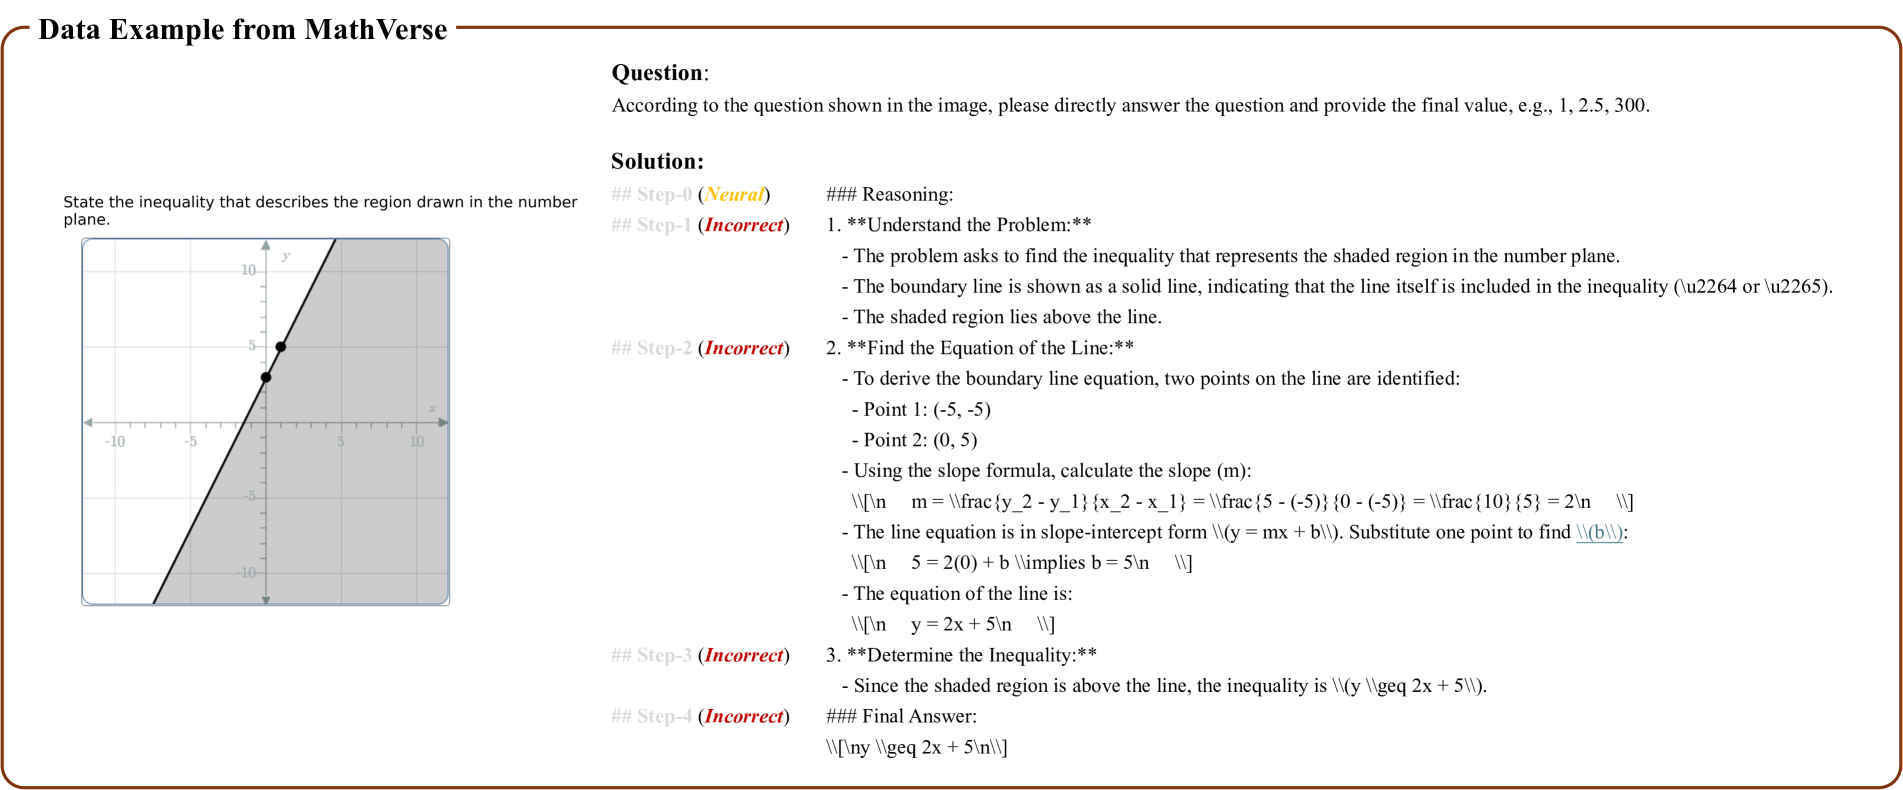
The image presents a problem involving an inequality represented graphically on a coordinate plane, along with a step-by-step solution. The problem asks to state the inequality that describes the shaded region in the number plane. The solution provides a reasoning process to arrive at the correct inequality.
### Components/Axes
* **Coordinate Plane:** A standard Cartesian coordinate plane with x and y axes.
* **x-axis:** Ranges from approximately -10 to 10, with tick marks at integer values.
* **y-axis:** Ranges from approximately -10 to 10, with tick marks at integer values.
* **Line:** A solid black line passes through the points (-5, -5) and (0, 5).
* **Shaded Region:** The area above the line is shaded in gray, indicating the region that satisfies the inequality.
* **Question:** Text asking to state the inequality that describes the shaded region.
* **Solution:** A step-by-step explanation of how to determine the inequality.
* **Steps:** The solution is broken down into steps, labeled "Step-0 (Neural)", "Step-1 (Incorrect)", "Step-2 (Incorrect)", "Step-3 (Incorrect)", and "Step-4 (Incorrect)".
* **Reasoning:** Each step includes reasoning to explain the process.
### Detailed Analysis or ### Content Details
**Coordinate Plane Details:**
* The x-axis and y-axis are labeled.
* The grid lines are light gray.
* The line intersects the y-axis at approximately y = 5.
* The line has a positive slope.
**Solution Breakdown:**
* **Step-0 (Neural):** This step is not elaborated upon.
* **Step-1 (Incorrect):**
* **Reasoning:**
* Understanding the problem: The problem asks to find the inequality that represents the shaded region. The boundary line is solid, indicating inclusion in the inequality. The shaded region is above the line.
* **Step-2 (Incorrect):**
* **Reasoning:**
* Finding the equation of the line: Two points on the line are identified: (-5, -5) and (0, 5).
* The slope (m) is calculated as:
```
m = (y2 - y1) / (x2 - x1) = (5 - (-5)) / (0 - (-5)) = 10 / 5 = 2
```
* The line equation is in slope-intercept form (y = mx + b). Substituting (0,5) to find b:
```
5 = 2(0) + b implies b = 5
```
* The equation of the line is:
```
y = 2x + 5
```
* **Step-3 (Incorrect):**
* **Reasoning:**
* Determining the inequality: Since the shaded region is above the line, the inequality is y ≥ 2x + 5.
* **Step-4 (Incorrect):**
* **Final Answer:**
```
y ≥ 2x + 5
```
### Key Observations
* The solution correctly identifies the key steps to solve the problem.
* The slope calculation and line equation derivation are accurate.
* The final inequality is correctly stated based on the shaded region.
* The steps are marked as "Incorrect", which suggests that the automated system evaluating the steps did not recognize the correct solution path.
### Interpretation
The image demonstrates a problem-solving approach to finding the inequality represented by a shaded region on a coordinate plane. The solution breaks down the problem into understanding the problem, finding the equation of the line, and determining the inequality. The steps are marked as incorrect, which may indicate an error in the automated evaluation system or a specific requirement not met by the provided solution. The solution correctly identifies the inequality as y ≥ 2x + 5, which represents all points on or above the line y = 2x + 5.