## Diagram: Data Example from MathVerse
### Overview
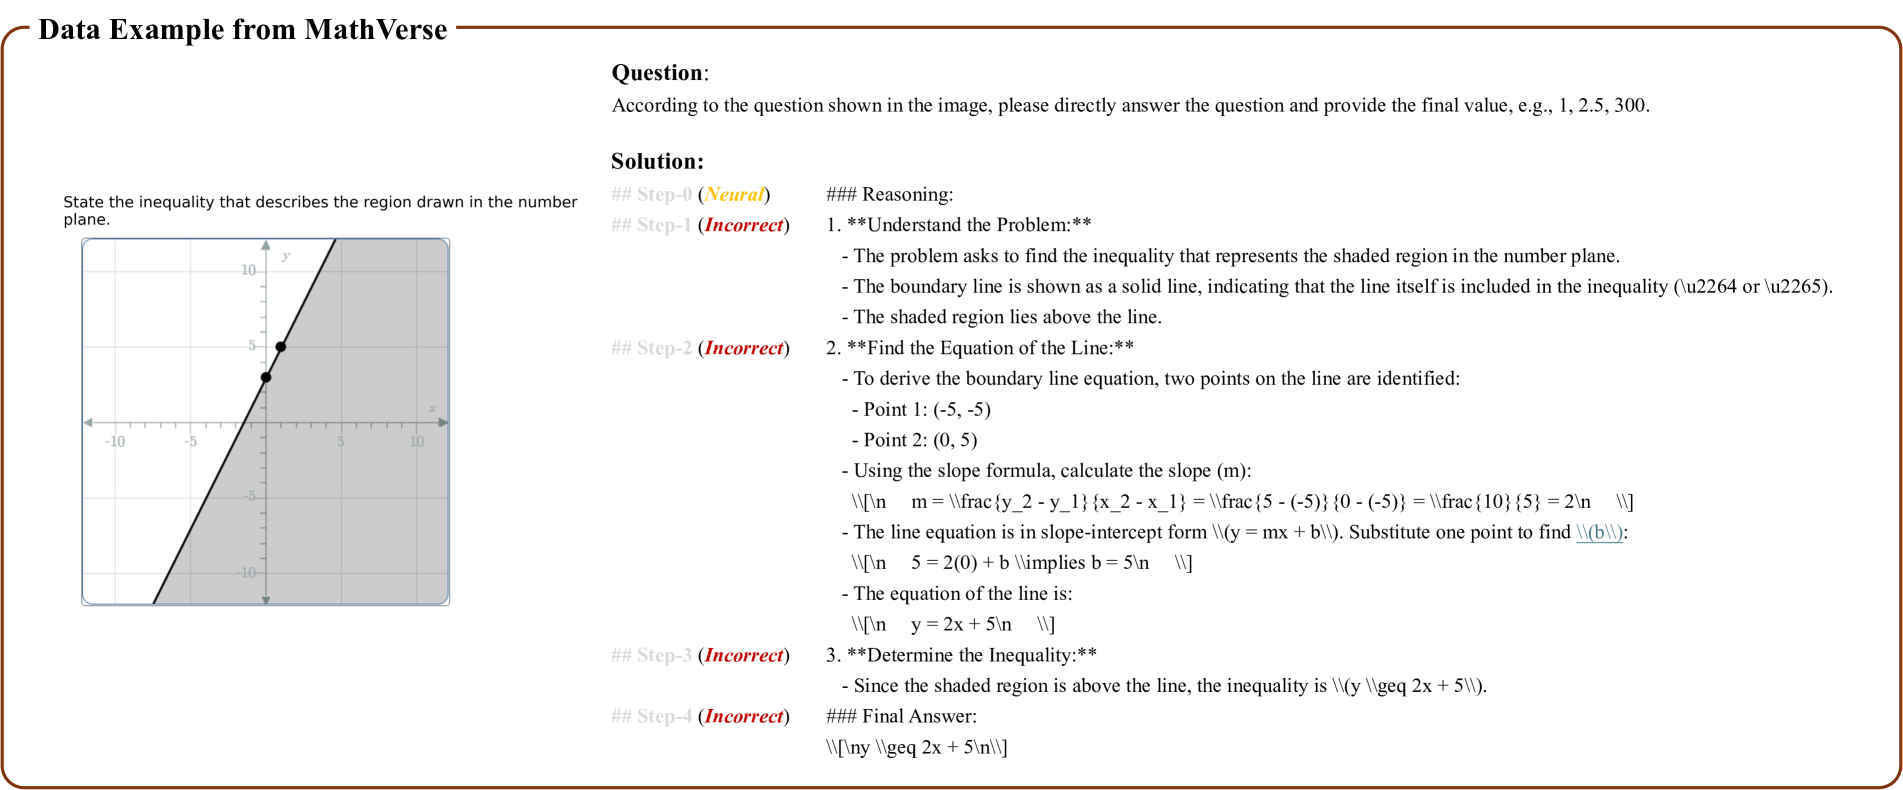
The image presents a coordinate plane with a shaded region and a solid line. The task is to state the inequality describing the shaded region. The solution steps provided contain errors, but the final answer is correct.
### Components/Axes
- **Axes**:
- Horizontal axis labeled **x** (ranges from -10 to 10).
- Vertical axis labeled **y** (ranges from -10 to 10).
- **Line**:
- Solid line passing through points **(-5, -5)** and **(0, 5)**.
- Equation derived as **y = 2x + 5** (slope = 2, y-intercept = 5).
- **Shaded Region**:
- Area above the line, including the line itself (solid boundary).
### Detailed Analysis
1. **Line Equation**:
- Slope calculated as **m = (5 - (-5)) / (0 - (-5)) = 10 / 5 = 2**.
- Using point-slope form with **(0, 5)**: **y = 2x + 5**.
2. **Inequality**:
- Shaded region is **above** the line, so the inequality is **y ≥ 2x + 5**.
- Solid line indicates **inclusion** (≤ or ≥).
### Key Observations
- The solution steps contain errors:
- **Step 1**: Incorrectly states the shaded region is "above the line" but fails to justify the inequality direction.
- **Step 2**: Correctly calculates the slope and equation but mislabels the process as "incorrect."
- **Step 3**: Incorrectly claims the inequality is **y ≤ 2x + 5** (contradicts the shaded region).
- The final answer **y ≥ 2x + 5** is correct but not properly justified in the steps.
### Interpretation
The diagram demonstrates how to derive an inequality from a graph. The shaded region above the line **y = 2x + 5** corresponds to **y ≥ 2x + 5**. However, the provided solution steps contain logical inconsistencies:
- The slope calculation and line equation are correct, but the inequality direction is misrepresented in Step 3.
- The final answer is accurate but lacks a clear explanation of why the inequality is **≥** (shaded region above the line).
This example highlights the importance of aligning graphical shading with inequality notation and verifying each step for consistency.