## Bar Chart: Performance of Agents on Private and Public Games
### Overview
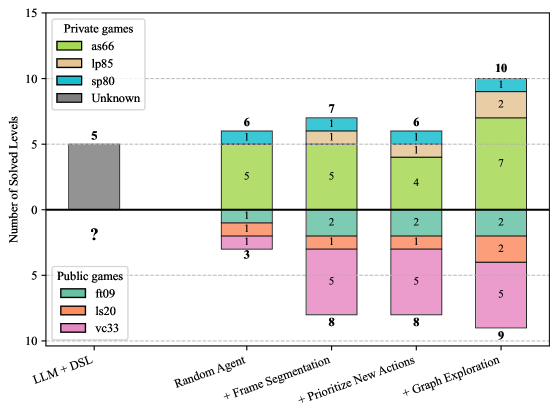
This image displays a diverging stacked bar chart comparing the performance of different agent configurations in solving levels for "Private games" (plotted on the positive y-axis) and "Public games" (plotted on the negative y-axis). The x-axis represents five distinct agent configurations, showing an incremental improvement process.
### Components/Axes
* **Y-Axis:** Labeled "Number of Solved Levels".
* Positive values (0 to 15) represent "Private games".
* Negative values (0 to 10) represent "Public games".
* **X-Axis:** Lists the agent configurations:
1. `LLM + DSL`
2. `Random Agent`
3. `+ Frame Segmentation`
4. `+ Prioritize New Actions`
5. `+ Graph Exploration`
* **Legends:**
* **Top-Left (Private games):**
* Light Green: `as66`
* Light Tan/Beige: `lp85`
* Cyan/Teal: `sp80`
* Grey: `Unknown`
* **Bottom-Left (Public games):**
* Greenish-Teal: `ft09`
* Orange/Peach: `ls20`
* Pink/Magenta: `vc33`
### Detailed Analysis
The following data is extracted from the stacked bars. The numbers inside the segments represent the count of solved levels for that specific sub-category.
| Configuration | Private Games (Top) | Total Private | Public Games (Bottom) | Total Public |
| :--- | :--- | :--- | :--- | :--- |
| **LLM + DSL** | Grey: 5 | **5** | ? (No data) | **?** |
| **Random Agent** | Green: 5, Cyan: 1 | **6** | Teal: 1, Orange: 1, Pink: 1 | **3** |
| **+ Frame Segmentation** | Green: 5, Tan: 1, Cyan: 1 | **7** | Teal: 2, Orange: 1, Pink: 5 | **8** |
| **+ Prioritize New Actions** | Green: 4, Tan: 1, Cyan: 1 | **6** | Teal: 2, Orange: 1, Pink: 5 | **8** |
| **+ Graph Exploration** | Green: 7, Tan: 2, Cyan: 1 | **10** | Teal: 2, Orange: 2, Pink: 5 | **9** |
*Note: The numbers above the top bars and below the bottom bars represent the total sum of solved levels for that column.*
### Key Observations
* **Incremental Improvement:** There is a clear upward trend in performance as features are added. The `+ Graph Exploration` configuration achieves the highest performance in both categories (10 Private, 9 Public).
* **Dominant Sub-categories:**
* In **Private games**, the `as66` (Green) component consistently contributes the highest number of solved levels, peaking at 7 in the final configuration.
* In **Public games**, the `vc33` (Pink) component is the primary driver of performance, consistently contributing 5 solved levels from the `+ Frame Segmentation` stage onwards.
* **Data Gap:** The `LLM + DSL` configuration is the only one that lacks data for "Public games," marked explicitly with a question mark.
* **Stability:** The `sp80` (Cyan) component in Private games is highly stable, contributing exactly 1 solved level across all configurations where it appears.
### Interpretation
This chart illustrates an ablation or incremental feature-addition study for an AI agent.
* **Performance Scaling:** The data suggests that "Graph Exploration" is the most critical feature for scaling performance, as it results in the highest jump in solved levels for Private games (from 6 to 10) and a slight increase for Public games (from 8 to 9).
* **Feature Specialization:** The consistent contribution of `vc33` (Pink) to Public games suggests that this specific sub-component is highly specialized for the Public game environment, whereas `as66` (Green) is the workhorse for Private games.
* **Baseline Comparison:** The `LLM + DSL` baseline is insufficient for comparison against the other agents regarding Public games, suggesting that the "Random Agent" and subsequent iterations are likely built upon a different or more advanced framework than the initial `LLM + DSL` test.