## Heatmap: Recurrence vs Hops Across Different Seeds
### Overview
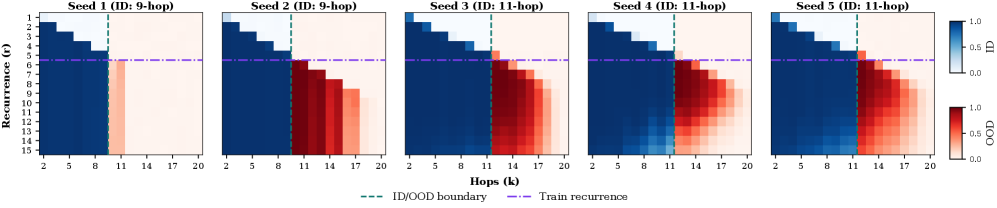
The image displays a 5-panel heatmap comparing recurrence patterns (y-axis) and hop counts (x-axis) across five experimental seeds (Seed 1-5). Each panel visualizes the relationship between hop count (k) and recurrence (r) with color intensity representing out-of-distribution (OOD) values. Key elements include dashed boundary lines and a color scale indicating OOD magnitude.
### Components/Axes
- **X-axis (Hops k)**: Integer values from 2 to 20, representing sequential steps in a process.
- **Y-axis (Recurrence r)**: Integer values from 1 to 15, indicating repetition frequency.
- **Legend**:
- Dashed green line: ID/OOD boundary (k=11)
- Dashed purple line: Train recurrence threshold (r=7)
- **Color Scale**: Blue (0.0 OOD) to Red (1.0 OOD), with intermediate values (0.25, 0.5, 0.75).
### Detailed Analysis
#### Panel 1 (Seed 1, ID:9-hop)
- **Structure**:
- Blue blocks dominate left of k=11 (ID/OOD boundary).
- Vertical red bar at (k=11, r=7) with moderate intensity (~0.6 OOD).
- No values above r=7.
- **Trend**: Minimal OOD before k=11; sharp increase at boundary.
#### Panel 2 (Seed 2, ID:9-hop)
- **Structure**:
- Similar to Seed 1 but with a red gradient extending to k=14.
- Red bar at (k=11, r=7) (~0.7 OOD).
- Additional red blocks at (k=14, r=8-10) (~0.5-0.7 OOD).
- **Trend**: Broader OOD region post-boundary compared to Seed 1.
#### Panel 3 (Seed 3, ID:11-hop)
- **Structure**:
- Red gradient starts earlier (k=9) with intensity ~0.4.
- Strong red bar at (k=11, r=7) (~0.8 OOD).
- Red blocks extend to k=17 (r=9-13) (~0.6-0.9 OOD).
- **Trend**: Earlier and more intense OOD activation.
#### Panel 4 (Seed 4, ID:11-hop)
- **Structure**:
- Blue-to-red gradient from k=5 (intensity ~0.2) to k=17.
- Red bar at (k=11, r=7) (~0.7 OOD).
- Red blocks at (k=14, r=8-10) (~0.5-0.7 OOD).
- **Trend**: Gradual OOD increase with moderate intensity.
#### Panel 5 (Seed 5, ID:11-hop)
- **Structure**:
- Red gradient from k=7 (intensity ~0.3) to k=20.
- Red bar at (k=11, r=7) (~0.8 OOD).
- Red blocks at (k=14, r=8-10) (~0.6-0.9 OOD) and (k=17, r=11-13) (~0.7-1.0 OOD).
- **Trend**: Highest OOD values across all panels.
### Key Observations
1. **Consistent Boundary**: All panels show a vertical red bar at (k=11, r=7), aligning with the ID/OOD boundary.
2. **Seed Progression**: Later seeds (3-5) exhibit earlier and more intense OOD activation compared to earlier seeds (1-2).
3. **Train Recurrence Threshold**: The purple line (r=7) intersects all red bars at k=11, suggesting a critical recurrence threshold.
4. **OOD Magnitude**: Seed 5 shows the highest OOD values (up to 1.0), while Seed 1 has the lowest (~0.6 max).
### Interpretation
The data demonstrates that increasing seed variability correlates with earlier and more pronounced OOD activation. The consistent red bar at (k=11, r=7) across all seeds suggests this point represents a critical transition in the model's behavior, possibly marking the boundary between in-distribution (ID) and out-of-distribution (OOD) data. The purple train recurrence line (r=7) acts as a reference point, indicating that OOD events consistently occur at or above this recurrence threshold. Seed 5's extreme OOD values (1.0) imply potential instability or overfitting in later experimental iterations, while Seed 1's lower values may reflect more robust performance. The heatmap highlights the importance of hop count (k) as a key factor in OOD detection, with later seeds showing reduced tolerance for deviations beyond the 11-hop boundary.