## Heatmap: Recurrence vs. Hops
### Overview
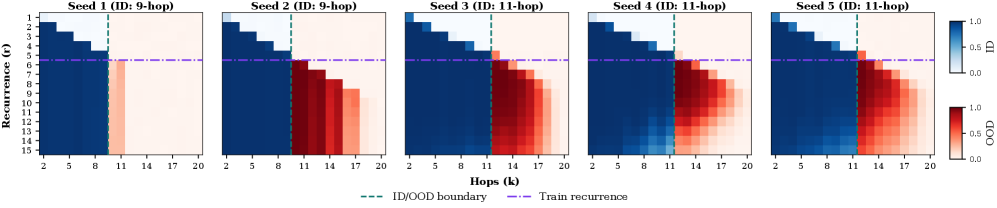
The image displays a heatmap titled "Recurrence vs. Hops" with five subplots, each representing a different seed ID (1 to 5) with varying hop lengths (9-hop, 11-hop). The heatmap shows the recurrence of certain events or patterns across different hop lengths.
### Components/Axes
- **X-axis (Hops)**: Represents the number of hops, ranging from 2 to 20.
- **Y-axis (Recurrence)**: Represents the recurrence rate, ranging from 0.0 to 1.0.
- **Legend**: Located at the bottom right, indicating the color scale for recurrence (0.0 to 1.0) and hop length (2 to 20).
- **ID/OOD boundary**: A dashed green line running vertically down the center of the heatmap.
- **Train recurrence**: A dashed purple line running horizontally across the heatmap.
### Detailed Analysis
Each subplot shows a grid of squares where the color intensity represents the recurrence rate. The darker the color, the higher the recurrence rate. The ID/OOD boundary (dashed green line) and train recurrence (dashed purple line) serve as reference points to compare the recurrence rates across different hop lengths.
### Key Observations
- **Seed 1 (9-hop)**: Shows a relatively high recurrence rate across most hop lengths, with a slight decrease towards the higher end of the hop range.
- **Seed 2 (9-hop)**: Similar to Seed 1, with a high recurrence rate but slightly lower than Seed 1.
- **Seed 3 (11-hop)**: Shows a moderate recurrence rate, with a slight increase towards the higher end of the hop range.
- **Seed 4 (11-hop)**: Similar to Seed 3, with a moderate recurrence rate and a slight increase towards the higher end of the hop range.
- **Seed 5 (11-hop)**: Shows a high recurrence rate, similar to Seed 1 and Seed 2.
### Interpretation
The heatmap suggests that the recurrence rate is generally higher for Seed 1 and Seed 2 across most hop lengths, while Seed 3 and Seed 4 show a moderate recurrence rate with a slight increase towards the higher end of the hop range. Seed 5 shows a high recurrence rate, similar to Seed 1 and Seed 2. The ID/OOD boundary and train recurrence lines help in understanding the distribution of recurrence rates and the impact of hop length on the recurrence of events or patterns.