TECHNICAL ASSET FINGERPRINT
760b557fb256230cdce05180
Click to view fullscreen
Press ESC or click to close
FOUND IN PAPERS
EXPERT: healer-alpha-free VERSION 1
RUNTIME: free/openrouter/healer-alpha
INTEL_VERIFIED
## Causal Diagrams: Law School Admissions & Adult Census Income
### Overview
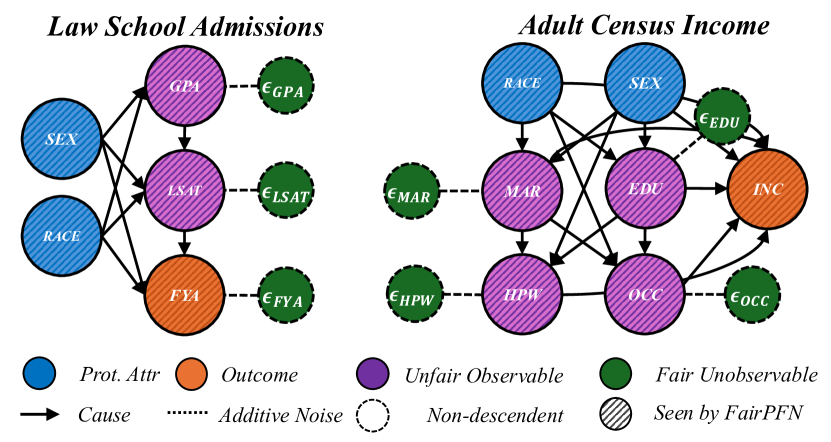
The image displays two side-by-side causal diagrams (directed acyclic graphs) illustrating the relationships between variables in two different fairness-related datasets: "Law School Admissions" and "Adult Census Income." The diagrams use a color-coded and line-style-coded legend to categorize variable types and relationship types. The overall purpose is to model how protected attributes (like sex and race) causally influence outcomes (like first-year average grades or income), mediated by other observable and unobservable factors.
### Components/Axes
**Legend (Bottom Center):**
* **Colors & Node Types:**
* Blue Circle: `Prot. Attr` (Protected Attribute)
* Orange Circle: `Outcome`
* Purple Circle: `Unfair Observable`
* Green Circle: `Fair Unobservable`
* **Line Styles & Relationship Types:**
* Solid Arrow: `Cause`
* Dashed Line: `Additive Noise`
* Dotted Line: `Non-descendent`
* **Node Fill Pattern:**
* Diagonal Hatching: `Seen by FairPFN`
**Diagram 1: Law School Admissions (Left Side)**
* **Protected Attributes (Blue, Left):** `SEX`, `RACE`
* **Unfair Observables (Purple, Center):** `GPA`, `LSAT`
* **Outcome (Orange, Bottom-Right):** `FYA` (First-Year Average)
* **Fair Unobservables (Green, Right):** `ε_GPA`, `ε_LSAT`, `ε_FYA`
* **Causal Flow:** `SEX` and `RACE` have direct causal arrows pointing to `GPA`, `LSAT`, and `FYA`. `GPA` points to `LSAT`, and `LSAT` points to `FYA`. Each unfair observable (`GPA`, `LSAT`) and the outcome (`FYA`) is connected via a dashed "Additive Noise" line to a corresponding fair unobservable (`ε_GPA`, `ε_LSAT`, `ε_FYA`).
**Diagram 2: Adult Census Income (Right Side)**
* **Protected Attributes (Blue, Top):** `RACE`, `SEX`
* **Unfair Observables (Purple, Middle/Bottom):** `MAR` (Marital Status), `EDU` (Education), `HPW` (Hours per Week), `OCC` (Occupation)
* **Outcome (Orange, Right):** `INC` (Income)
* **Fair Unobservables (Green, Scattered):** `ε_MAR`, `ε_EDU`, `ε_HPW`, `ε_OCC`
* **Causal Flow:** This is a more complex network.
* `RACE` and `SEX` have arrows pointing to `MAR`, `EDU`, `HPW`, `OCC`, and `INC`.
* `MAR` points to `HPW` and `OCC`.
* `EDU` points to `OCC` and `INC`.
* `HPW` points to `INC`.
* `OCC` points to `INC`.
* Each unfair observable (`MAR`, `EDU`, `HPW`, `OCC`) is connected via a dashed "Additive Noise" line to a corresponding fair unobservable (`ε_MAR`, `ε_EDU`, `ε_HPW`, `ε_OCC`).
* A dotted "Non-descendent" line connects `ε_EDU` to `INC`.
### Detailed Analysis
**Node Inventory and Relationships:**
1. **Law School Admissions Diagram:**
* **Direct Causes of FYA:** `SEX`, `RACE`, `LSAT`.
* **Mediated Paths:** `SEX`/`RACE` -> `GPA` -> `LSAT` -> `FYA`. `SEX`/`RACE` -> `LSAT` -> `FYA`.
* **Noise Injection:** The model explicitly includes unobserved, fair factors (`ε` terms) that additively influence the observed variables `GPA`, `LSAT`, and `FYA`.
2. **Adult Census Income Diagram:**
* **Direct Causes of INC:** `SEX`, `RACE`, `EDU`, `HPW`, `OCC`.
* **Key Mediators:** `EDU` and `OCC` are central hubs. `EDU` influences `OCC` and `INC`. `OCC` is influenced by `RACE`, `SEX`, `MAR`, and `EDU`, and in turn influences `INC`.
* **Complex Interactions:** `MAR` (Marital Status) is modeled as being caused by `RACE` and `SEX`, and it subsequently influences `HPW` and `OCC`.
* **Noise & Non-descendent:** Fair unobservables (`ε`) add noise to `MAR`, `EDU`, `HPW`, and `OCC`. Notably, `ε_EDU` has a dotted "Non-descendent" relationship to `INC`, suggesting it is not a descendant of the protected attributes in the causal graph but may still be correlated.
**Spatial Grounding:**
* The **legend** is positioned at the bottom, centered horizontally.
* In both diagrams, **Protected Attributes (Blue)** are placed on the far left or top.
* **Outcomes (Orange)** are placed on the far right or bottom-right.
* **Unfair Observables (Purple)** occupy the central space between protected attributes and outcomes.
* **Fair Unobservables (Green)** are placed adjacent to their corresponding unfair observable, typically to the right.
### Key Observations
1. **Structural Difference:** The Law School diagram is a simpler, more linear chain, while the Adult Census diagram is a dense, interconnected network, reflecting the greater complexity of socioeconomic factors.
2. **Common Pattern:** In both models, protected attributes (`SEX`, `RACE`) have **direct causal arrows to the final outcome** (`FYA`, `INC`), not just indirect paths through mediators. This is a critical modeling choice for fairness analysis.
3. **Role of "Unfair Observable":** Variables like `GPA`, `LSAT`, `EDU`, and `OCC` are labeled "Unfair Observable." This implies that while they are observed and causally influence the outcome, they may themselves be influenced by protected attributes, making their use in prediction potentially discriminatory.
4. **Explicit Noise Modeling:** The inclusion of `ε` (epsilon) nodes for "Fair Unobservable" factors explicitly acknowledges that not all variance in the observed variables is explained by the modeled causes; some is due to random, fair noise.
5. **FairPFN Context:** The hatching pattern indicating "Seen by FairPFN" suggests these diagrams are part of an analysis or methodology related to a fairness-aware model or algorithm named FairPFN.
### Interpretation
These diagrams are **causal models for algorithmic fairness auditing**. They map the hypothesized real-world mechanisms through which sensitive attributes like race and sex might influence important outcomes (academic success, income).
* **What the data suggests:** The models argue that bias can flow through two primary channels: 1) **Direct influence** of protected attributes on outcomes, and 2) **Indirect influence** where protected attributes shape intermediary factors (test scores, education, occupation) which then determine outcomes. The "Unfair Observable" label is a normative judgment, indicating that using these intermediaries for prediction could perpetuate historical inequities.
* **Relationship between elements:** The diagrams establish a **chain of causality**. The protected attributes are root causes. The unfair observables are mediators that are "tainted" by the root causes. The outcome is the final effect. The fair unobservables represent legitimate, random variation. The arrows define the permissible paths for influence.
* **Notable implications:** The direct arrows from `SEX`/`RACE` to `INC`/`FYA` are significant. They imply that even if one controls for all mediators (education, occupation, test scores), a direct disparity might remain, pointing to potential direct discrimination or the influence of unmeasured mediators. The complexity of the Adult Census diagram highlights why fairness in socioeconomic contexts is particularly challenging—interventions (e.g., on education) can have cascading effects through the network. The models provide a structured framework for asking "what-if" questions and designing fairness interventions that respect the causal structure of the problem.
DECODING INTELLIGENCE...