## Chart Description
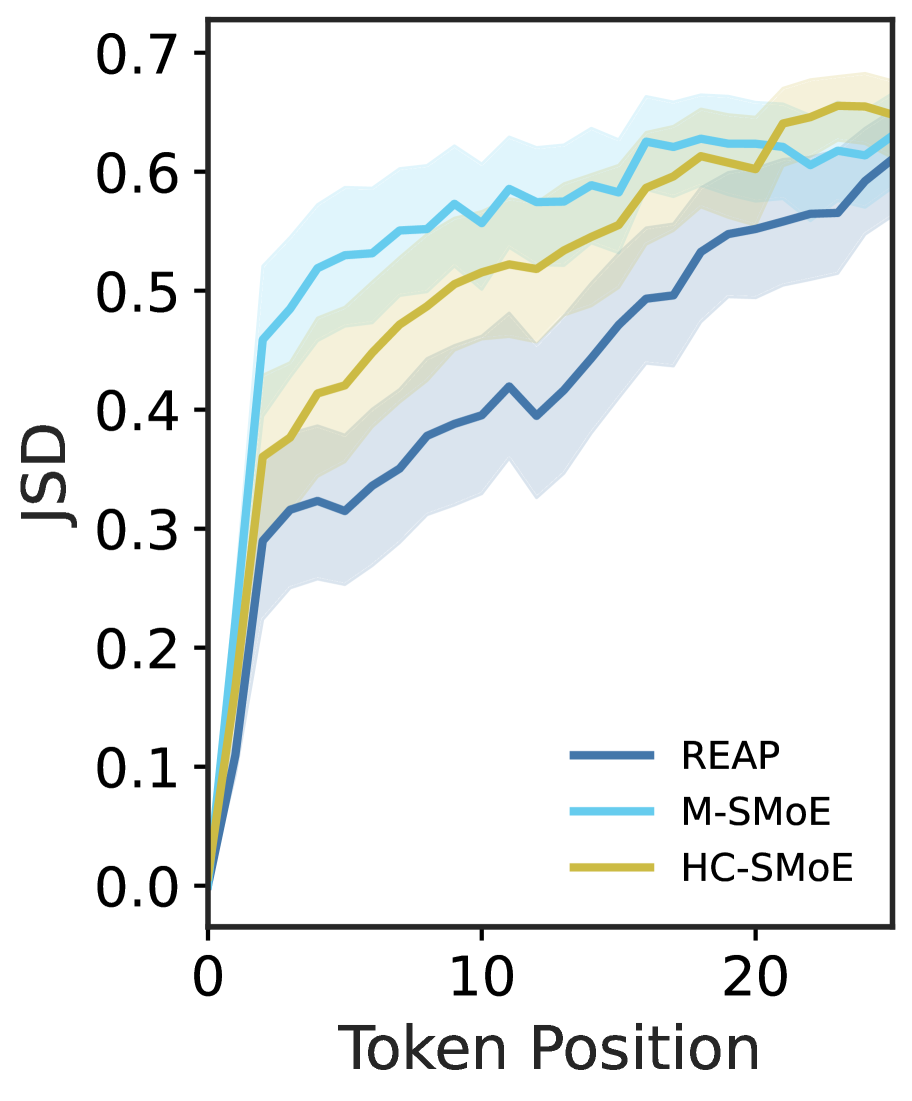
This is a line chart plotting **JSD** on the y-axis against **Token Position** on the x-axis. The chart compares three different models: **REAP**, **M-SMoE**, and **HC-SMoE**. Each model is represented by a colored line with a corresponding shaded area indicating the confidence interval or standard deviation.
### Axes
* **Y-axis:** Labeled "JSD". The scale ranges from 0.0 to 0.7, with major tick marks at 0.0, 0.1, 0.2, 0.3, 0.4, 0.5, 0.6, and 0.7.
* **X-axis:** Labeled "Token Position". The scale ranges from 0 to 25, with major tick marks at 0, 10, and 20.
### Legend
The legend is located in the bottom right corner of the chart and defines the colors for each model:
* **REAP:** Dark blue line.
* **M-SMoE:** Light blue line.
* **HC-SMoE:** Gold/yellow line.
### Data Trends
All three models show an increasing trend in JSD as the Token Position increases, starting from a JSD of 0.0 at Token Position 0.
1. **REAP (Dark Blue):**
* The line starts at (0, 0) and rises steeply to approximately 0.3 at Token Position 2.
* The increase becomes more gradual, reaching a JSD of approximately 0.6 at Token Position 25.
* The shaded area around the line indicates a moderate level of variability, roughly ±0.05 JSD units.
2. **M-SMoE (Light Blue):**
* The line starts at (0, 0) and shows the steepest initial rise among the three models, reaching approximately 0.45 at Token Position 2.
* It continues to rise, reaching a JSD of approximately 0.62 at Token Position 25.
* The shaded area is wider than REAP's, indicating higher variability, roughly ±0.05-0.08 JSD units.
3. **HC-SMoE (Gold/Yellow):**
* The line starts at (0, 0) and rises steeply to approximately 0.35 at Token Position 2.
* It continues to rise, generally staying between the REAP and M-SMoE lines, and reaches the highest JSD of approximately 0.65 at Token Position 25.
* The shaded area is similar in width to M-SMoE's, indicating comparable variability.
Overall, M-SMoE and HC-SMoE show a faster initial increase in JSD compared to REAP. HC-SMoE achieves the highest final JSD value at Token Position 25, followed by M-SMoE and then REAP.