# Technical Document Extraction: Line Chart Analysis
## Chart Type
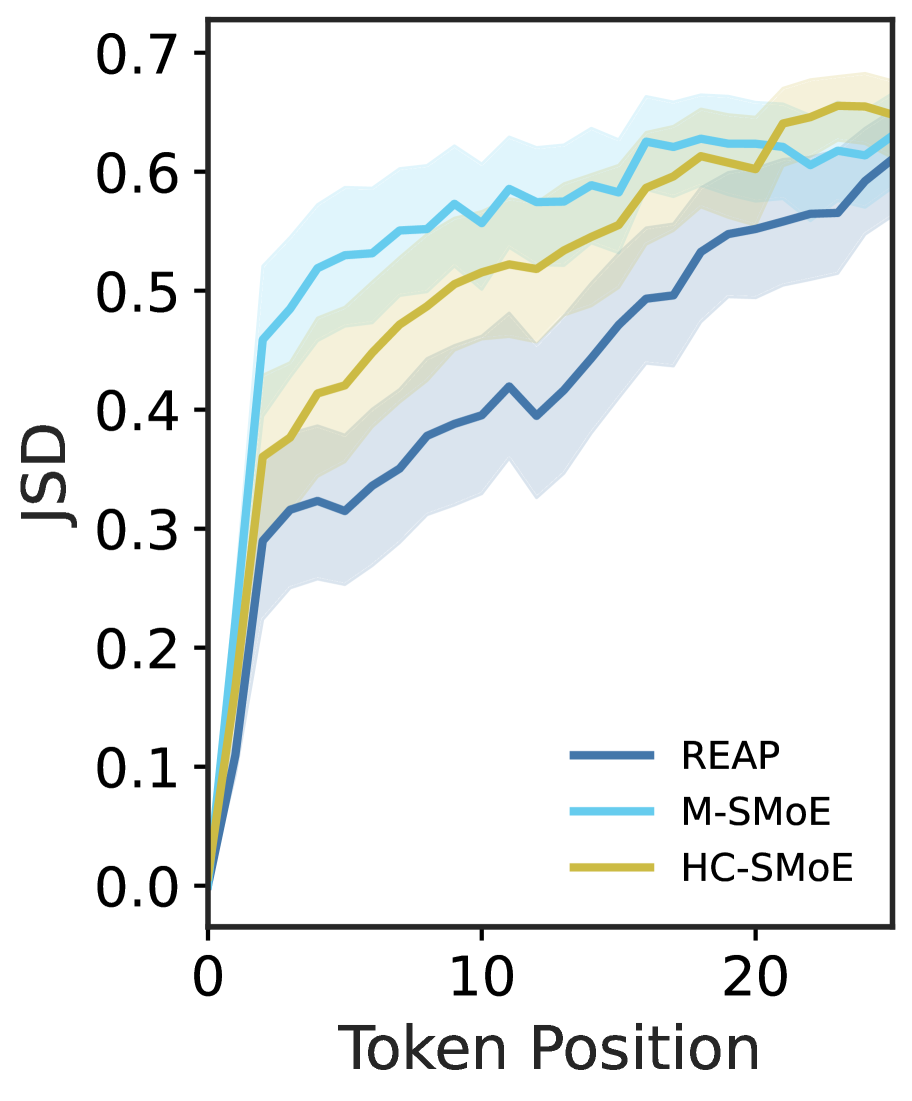
Line chart with shaded confidence intervals.
## Axis Labels
- **X-axis**: Token Position (0 to 20, increments of 10)
- **Y-axis**: JSD (0.0 to 0.7, increments of 0.1)
## Legend
- **REAP**: Dark blue line
- **M-SMoE**: Light blue line
- **HC-SMoE**: Gold line
## Key Trends
1. **Initial Behavior**:
- All lines start at (0, 0) and rise sharply in the first 5 token positions.
- HC-SMoE (gold) begins highest, followed by M-SMoE (light blue), then REAP (dark blue).
2. **Mid-Range (Token Positions 5–15)**:
- Lines diverge further, with HC-SMoE maintaining the highest JSD values.
- M-SMoE shows moderate growth, while REAP lags slightly behind.
3. **Final Segment (Token Positions 15–20)**:
- All lines plateau near 0.6–0.65 JSD.
- HC-SMoE remains the highest, with REAP approaching M-SMoE but not surpassing it.
## Shaded Regions
- Gray bands around each line represent confidence intervals or error margins.
- HC-SMoE exhibits the widest variability (broadest shaded region), particularly after token position 10.
## Data Points
- **Token Position 0**: All lines at 0.0 JSD.
- **Token Position 10**:
- REAP: ~0.4
- M-SMoE: ~0.55
- HC-SMoE: ~0.5
- **Token Position 20**:
- REAP: ~0.6
- M-SMoE: ~0.62
- HC-SMoE: ~0.65
## Observations
- Lines do not intersect; relative order (HC-SMoE > M-SMoE > REAP) is preserved throughout.
- JSD values for all models increase monotonically with token position.
- HC-SMoE demonstrates the steepest initial growth and highest final JSD.