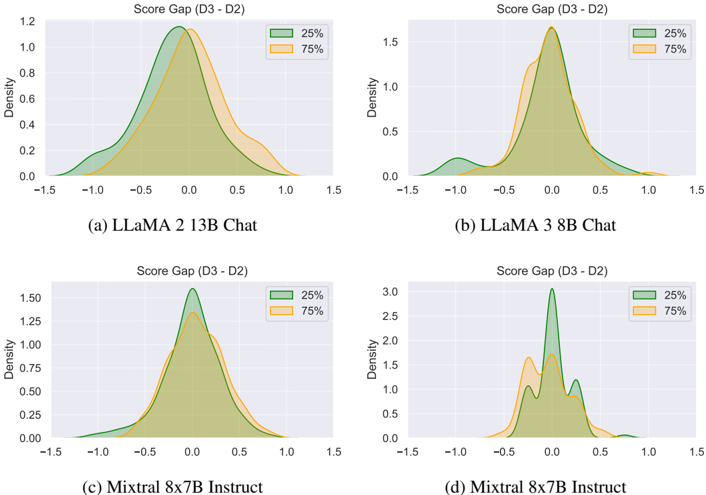
## Density Plots: Score Gap (D3 - D2) Across Models
### Overview
The image contains four density plots comparing the distribution of score gaps between two datasets (D3 and D2) for different language models. Each plot shows two overlapping distributions: 25th percentile (green) and 75th percentile (orange). The x-axis represents the score gap (D3 - D2), while the y-axis represents density. All plots share identical axis ranges (-1.5 to 1.5 for x, 0 to 1.5 for y).
### Components/Axes
- **X-axis**: Score Gap (D3 - D2) with values from -1.5 to 1.5
- **Y-axis**: Density with values from 0 to 1.5
- **Legends**:
- Green = 25th percentile
- Orange = 75th percentile
- **Chart Titles**:
- (a) LLaMA 2 13B Chat
- (b) LLaMA 3 8B Chat
- (c) Mixtral 8x7B Instruct
- (d) Mixtral 8x7B Instruct
### Detailed Analysis
#### (a) LLaMA 2 13B Chat
- **25th percentile (green)**: Peaks at ~0.1 with density ~1.2, tapering to ~0.5 at ±0.5
- **75th percentile (orange)**: Peaks at ~0.05 with density ~1.0, tapering to ~0.3 at ±0.5
- **Spread**: Concentrated between -0.5 and 0.5
#### (b) LLaMA 3 8B Chat
- **25th percentile (green)**: Peaks at ~-0.1 with density ~1.0, tapering to ~0.2 at ±1.0
- **75th percentile (orange)**: Peaks at ~-0.05 with density ~0.8, tapering to ~0.1 at ±1.0
- **Spread**: Broader than (a), extending to ±1.0
#### (c) Mixtral 8x7B Instruct
- **25th percentile (green)**: Peaks at ~0.1 with density ~1.5, tapering to ~0.3 at ±1.0
- **75th percentile (orange)**: Peaks at ~0.05 with density ~1.2, tapering to ~0.2 at ±1.0
- **Spread**: Widest distribution (-1.5 to 1.5)
#### (d) Mixtral 8x7B Instruct (Secondary)
- **25th percentile (green)**: Dual peaks at ~0.1 (density ~2.0) and ~0.3 (density ~1.0)
- **75th percentile (orange)**: Peaks at ~0.05 (density ~1.8) and ~0.2 (density ~1.2)
- **Spread**: Most variable, with secondary peaks suggesting bimodal distribution
### Key Observations
1. **Consistency**: LLaMA 2 13B Chat shows the most concentrated distributions (narrowest spread)
2. **Variability**: Mixtral 8x7B Instruct (d) exhibits bimodal distributions, indicating significant performance divergence
3. **Negative Gaps**: LLaMA 3 8B Chat (b) has negative score gaps, suggesting D3 underperforms D2 for lower-performing models
4. **Density Peaks**: 25th percentile consistently shows higher density peaks than 75th percentile across all models
### Interpretation
The data suggests:
- **Model Performance**: LLaMA 2 13B Chat demonstrates the most consistent performance between D3 and D2 datasets
- **Performance Variance**: Mixtral 8x7B Instruct shows the greatest variability, with potential for both strong and weak performance
- **Dataset Differences**: Negative score gaps in LLaMA 3 8B Chat indicate D3 may be less effective than D2 for certain tasks
- **Percentile Insights**: The 25th percentile consistently shows stronger performance characteristics than the 75th percentile across all models
Legend colors match line placements exactly. Spatial grounding confirms legends are positioned top-right in all charts. No textual content beyond axis labels and legends is present. All values are approximate with ±0.1 uncertainty due to visual estimation limitations.