\n
## Line Chart: Accuracy vs. Thinking Compute
### Overview
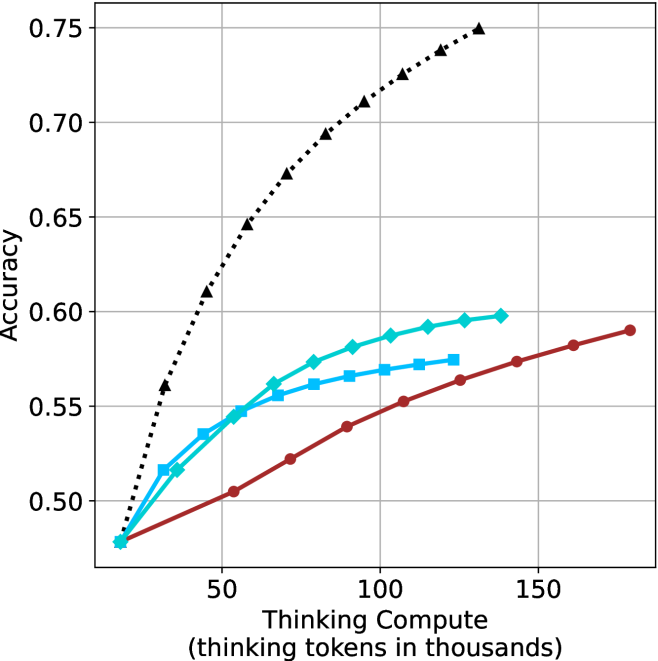
The image presents a line chart illustrating the relationship between "Thinking Compute" (measured in thousands of tokens) and "Accuracy". Four distinct data series are plotted, each represented by a different colored line. The chart appears to demonstrate how accuracy improves with increased computational effort (thinking tokens).
### Components/Axes
* **X-axis:** "Thinking Compute (thinking tokens in thousands)". Scale ranges from approximately 0 to 160, with tick marks at 0, 50, 100, and 150.
* **Y-axis:** "Accuracy". Scale ranges from approximately 0.48 to 0.76, with tick marks at 0.50, 0.55, 0.60, 0.65, 0.70, and 0.75.
* **Data Series:** Four lines are present, each with a unique color and pattern:
* Black dotted line
* Cyan dashed line
* Teal solid line
* Red solid line
* **Legend:** There is no explicit legend present in the image.
### Detailed Analysis
Let's analyze each line individually, noting trends and approximate data points.
* **Black Dotted Line:** This line exhibits the steepest upward trend, indicating the most rapid increase in accuracy with increasing thinking compute.
* At 0 tokens: Approximately 0.48 accuracy.
* At 50 tokens: Approximately 0.62 accuracy.
* At 100 tokens: Approximately 0.70 accuracy.
* At 150 tokens: Approximately 0.74 accuracy.
* **Cyan Dashed Line:** This line shows a moderate upward trend, less steep than the black line but more pronounced than the teal and red lines.
* At 0 tokens: Approximately 0.49 accuracy.
* At 50 tokens: Approximately 0.57 accuracy.
* At 100 tokens: Approximately 0.59 accuracy.
* At 150 tokens: Approximately 0.60 accuracy.
* **Teal Solid Line:** This line demonstrates a slow, relatively flat upward trend.
* At 0 tokens: Approximately 0.48 accuracy.
* At 50 tokens: Approximately 0.54 accuracy.
* At 100 tokens: Approximately 0.57 accuracy.
* At 150 tokens: Approximately 0.59 accuracy.
* **Red Solid Line:** This line exhibits the slowest upward trend, with a minimal increase in accuracy over the observed range.
* At 0 tokens: Approximately 0.47 accuracy.
* At 50 tokens: Approximately 0.52 accuracy.
* At 100 tokens: Approximately 0.56 accuracy.
* At 150 tokens: Approximately 0.58 accuracy.
### Key Observations
* The black dotted line consistently outperforms the other three lines across all values of "Thinking Compute".
* The red solid line consistently underperforms the other three lines.
* The cyan and teal lines show similar performance, with the cyan line slightly outperforming the teal line.
* The rate of accuracy improvement diminishes for all lines as "Thinking Compute" increases, suggesting a point of diminishing returns.
### Interpretation
The chart suggests that increasing "Thinking Compute" generally leads to improved accuracy, but the effectiveness of this increase varies significantly depending on the specific method or model being used. The black dotted line likely represents a highly efficient approach, while the red solid line represents a less effective one. The diminishing returns observed for all lines indicate that there is a limit to the accuracy gains achievable through simply increasing computational effort. Further investigation would be needed to understand the underlying reasons for these differences in performance and to determine the optimal balance between computational cost and accuracy. The lack of a legend makes it difficult to determine what each line represents, but the data clearly demonstrates a hierarchy of performance.