## Chart: Scaling Training Data for MATH-500
### Overview
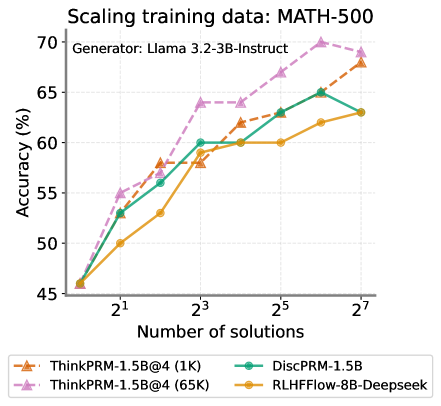
The image is a line chart comparing the accuracy (%) of different models (ThinkPRM-1.5B@4 (1K), ThinkPRM-1.5B@4 (65K), DiscPRM-1.5B, and RLHFFlow-8B-Deepseek) against the number of solutions (2^1, 2^3, 2^5, 2^7) used for scaling training data. The data is for the MATH-500 dataset, and the generator used was Llama 3.2-3B-Instruct.
### Components/Axes
* **Title:** Scaling training data: MATH-500
* **Subtitle:** Generator: Llama 3.2-3B-Instruct
* **Y-axis:** Accuracy (%)
* Scale ranges from 45 to 70, with tick marks at intervals of 5.
* **X-axis:** Number of solutions
* Values: 2^1, 2^3, 2^5, 2^7
* **Legend:** Located at the bottom of the chart.
* ThinkPRM-1.5B@4 (1K) (Orange with triangle markers)
* ThinkPRM-1.5B@4 (65K) (Pink with triangle markers, dashed line)
* DiscPRM-1.5B (Teal with circle markers)
* RLHFFlow-8B-Deepseek (Yellow with circle markers)
### Detailed Analysis
* **ThinkPRM-1.5B@4 (1K) (Orange, triangle markers):**
* Trend: Generally increasing.
* Data Points:
* 2^1: ~46%
* 2^3: ~58%
* 2^5: ~62%
* 2^7: ~68%
* **ThinkPRM-1.5B@4 (65K) (Pink, triangle markers, dashed line):**
* Trend: Increasing, plateaus, then increases again.
* Data Points:
* 2^1: ~55%
* 2^3: ~64%
* 2^5: ~64%
* 2^7: ~70%
* **DiscPRM-1.5B (Teal, circle markers):**
* Trend: Increasing, plateaus, then slightly increases.
* Data Points:
* 2^1: ~53%
* 2^3: ~60%
* 2^5: ~65%
* 2^7: ~63%
* **RLHFFlow-8B-Deepseek (Yellow, circle markers):**
* Trend: Increasing, plateaus.
* Data Points:
* 2^1: ~50%
* 2^3: ~62%
* 2^5: ~60%
* 2^7: ~63%
### Key Observations
* ThinkPRM-1.5B@4 (65K) achieves the highest accuracy at 2^7 solutions.
* DiscPRM-1.5B and RLHFFlow-8B-Deepseek plateau in accuracy after 2^3 solutions.
* ThinkPRM-1.5B@4 (1K) shows a steady increase in accuracy across all solution counts.
### Interpretation
The chart illustrates the impact of scaling training data on the accuracy of different models for the MATH-500 dataset. ThinkPRM-1.5B@4 (65K) benefits the most from increased training data, achieving the highest accuracy. DiscPRM-1.5B and RLHFFlow-8B-Deepseek show diminishing returns after a certain point, suggesting that increasing the number of solutions beyond 2^3 does not significantly improve their performance. ThinkPRM-1.5B@4 (1K) shows a consistent improvement with more data, indicating it may benefit from even further scaling. The choice of model and the optimal amount of training data depend on the specific performance requirements and computational resources available.