## Line Chart: Scaling Training Data - MATH-500
### Overview
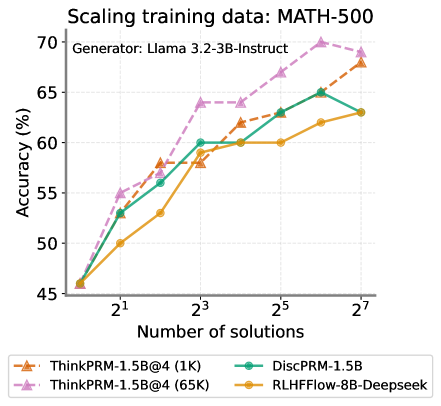
This line chart illustrates the relationship between the number of solutions used for training and the resulting accuracy on the MATH-500 dataset. Four different models are compared: ThinkPRM-1.5B@4 (1K), ThinkPRM-1.5B@4 (65K), DiscPRM-1.5B, and RLHFflow-8B-Deepseek. The generator used for all models is Llama 3.2-3B-Instruct.
### Components/Axes
* **Title:** Scaling training data: MATH-500
* **X-axis:** Number of solutions. Scale is logarithmic, with markers at 2<sup>1</sup>, 2<sup>3</sup>, 2<sup>5</sup>, and 2<sup>7</sup>.
* **Y-axis:** Accuracy (%). Scale ranges from 45% to 70%.
* **Legend:** Located at the bottom of the chart.
* ThinkPRM-1.5B@4 (1K) - Orange dashed line with triangle markers.
* ThinkPRM-1.5B@4 (65K) - Purple dashed line with triangle markers.
* DiscPRM-1.5B - Teal solid line with circle markers.
* RLHFflow-8B-Deepseek - Yellow solid line with circle markers.
### Detailed Analysis
* **ThinkPRM-1.5B@4 (1K):** The line starts at approximately 48% accuracy at 2<sup>1</sup> solutions, increases to around 58% at 2<sup>3</sup> solutions, then rises to approximately 65% at 2<sup>5</sup> solutions, and finally reaches about 68% at 2<sup>7</sup> solutions. The trend is generally upward, with diminishing returns as the number of solutions increases.
* **ThinkPRM-1.5B@4 (65K):** This line exhibits the steepest upward trend. It begins at approximately 50% accuracy at 2<sup>1</sup> solutions, jumps to around 63% at 2<sup>3</sup> solutions, continues to approximately 69% at 2<sup>5</sup> solutions, and reaches a peak of around 70% at 2<sup>7</sup> solutions.
* **DiscPRM-1.5B:** The line starts at approximately 52% accuracy at 2<sup>1</sup> solutions, increases to around 60% at 2<sup>3</sup> solutions, then rises to approximately 65% at 2<sup>5</sup> solutions, and plateaus at around 65% at 2<sup>7</sup> solutions.
* **RLHFflow-8B-Deepseek:** This line shows a moderate upward trend. It begins at approximately 47% accuracy at 2<sup>1</sup> solutions, increases to around 57% at 2<sup>3</sup> solutions, then rises to approximately 61% at 2<sup>5</sup> solutions, and finally reaches about 63% at 2<sup>7</sup> solutions.
### Key Observations
* The model ThinkPRM-1.5B@4 (65K) consistently outperforms the other models across all training data sizes.
* Increasing the training data size generally leads to improved accuracy for all models, but the rate of improvement diminishes as the number of solutions increases.
* DiscPRM-1.5B shows a plateau in accuracy after 2<sup>5</sup> solutions.
* RLHFflow-8B-Deepseek consistently has the lowest accuracy among the four models.
### Interpretation
The data suggests that scaling the training data size significantly improves the accuracy of these models on the MATH-500 dataset. The model ThinkPRM-1.5B@4 (65K) demonstrates the most substantial gains from increased training data, indicating that it benefits the most from a larger dataset. The logarithmic scale on the x-axis highlights the diminishing returns of adding more data; while initial increases in data size lead to large accuracy improvements, the gains become smaller as the dataset grows. The plateau observed in DiscPRM-1.5B suggests that this model may have reached its capacity to learn from the MATH-500 dataset, or that further improvements require architectural changes rather than simply more data. The consistent lower performance of RLHFflow-8B-Deepseek could be due to its architecture, training methodology, or other factors. Overall, the chart emphasizes the importance of data scaling in improving the performance of language models on mathematical reasoning tasks.