## Line Chart: Scaling training data: MATH-500
### Overview
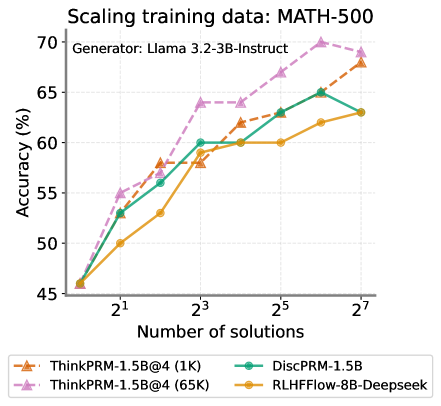
The chart illustrates the relationship between the number of training solutions (x-axis) and model accuracy (y-axis) for four different AI models. The x-axis uses exponential scaling (2¹, 2³, 2⁵, 2⁷), while the y-axis shows accuracy percentages from 45% to 70%. Four distinct data series are plotted with unique colors and markers.
### Components/Axes
- **X-axis**: "Number of solutions" with logarithmic spacing (2¹, 2³, 2⁵, 2⁷)
- **Y-axis**: "Accuracy (%)" ranging from 45% to 70%
- **Legend**: Located at the bottom, with four entries:
- Orange triangle: ThinkPRM-1.5B@4 (1K)
- Teal circle: DiscPRM-1.5B
- Purple diamond: ThinkPRM-1.5B@4 (65K)
- Yellow square: RLHFFlow-8B-Deepseek
- **Title**: "Scaling training data: MATH-500" (top center)
- **Subtitle**: "Generator: Llama 3.2-3B-Instruct" (top left)
### Detailed Analysis
1. **ThinkPRM-1.5B@4 (1K)** (Orange triangle):
- Starts at ~45% accuracy at 2¹
- Gradual increase to ~55% at 2³
- Sharp rise to ~60% at 2⁵
- Plateaus near 60% at 2⁷
2. **DiscPRM-1.5B** (Teal circle):
- Begins at ~45% at 2¹
- Steady climb to ~55% at 2³
- Accelerated growth to ~60% at 2⁵
- Continues to ~62% at 2⁷
3. **ThinkPRM-1.5B@4 (65K)** (Purple diamond):
- Starts at ~50% at 2¹
- Rapid ascent to ~60% at 2³
- Sustained growth to ~65% at 2⁵
- Peaks at ~68% at 2⁷
4. **RLHFFlow-8B-Deepseek** (Yellow square):
- Initial value ~45% at 2¹
- Moderate increase to ~52% at 2³
- Steep rise to ~63% at 2⁵
- Levels off near 63% at 2⁷
### Key Observations
- **Performance Gaps**: ThinkPRM-1.5B@4 (65K) consistently outperforms other models, achieving ~68% accuracy at 2⁷ vs. ~63% for RLHFFlow-8B-Deepseek.
- **Scaling Efficiency**: ThinkPRM-1.5B@4 (65K) shows the steepest improvement curve, suggesting superior data utilization.
- **Baseline Comparison**: The 1K solution variant (ThinkPRM-1.5B@4) underperforms across all metrics, highlighting the importance of training data volume.
- **Model Specialization**: RLHFFlow-8B-Deepseek demonstrates strong scaling despite being a different architecture, indicating robust design.
### Interpretation
The data demonstrates that increasing training data volume (solutions) correlates with improved accuracy across all models, with diminishing returns at higher solution counts. The ThinkPRM-1.5B@4 (65K) model's superior performance suggests that:
1. **Data Quality Matters**: The 65K solution variant likely incorporates more diverse or higher-quality examples.
2. **Architectural Synergy**: The Llama 3.2-3B-Instruct generator may be particularly well-suited to this scaling approach.
3. **Efficiency Tradeoffs**: While RLHFFlow-8B-Deepseek shows strong scaling, its lower final accuracy suggests potential tradeoffs between model size and data efficiency.
Notably, the chart reveals that even modest increases in training data (e.g., 2³ to 2⁵ solutions) yield significant accuracy gains, emphasizing the value of data scaling in LLM development. The performance gap between 1K and 65K solution variants underscores the critical role of training data quantity in achieving state-of-the-art results.