## Diagram: Comparison of Sampling Strategies
### Overview
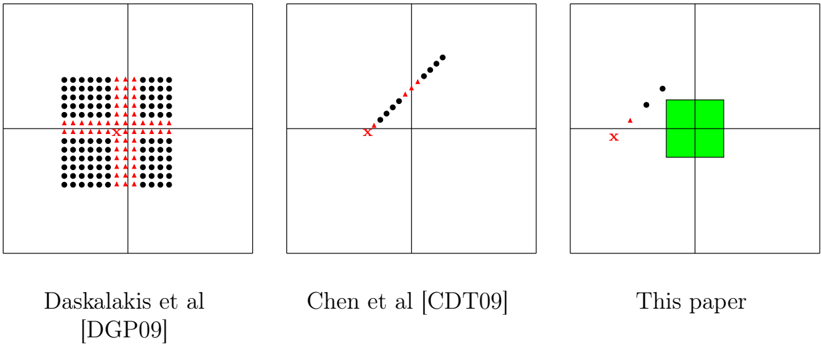
The image presents three distinct conceptual diagrams, arranged horizontally, illustrating different methodologies for data distribution or sampling within a 2D coordinate plane. Each panel features a square frame divided into four quadrants by a central crosshair (representing the x and y axes). The diagrams are labeled "Daskalakis et al [DGP09]", "Chen et al [CDT09]", and "This paper" respectively.
### Components/Axes
* **Common Structure:** Each panel is a square with a central origin (0,0) marked by a red 'x'.
* **Symbols:**
* **Black dots:** Represent specific data points or sampling locations.
* **Red triangles:** Represent a secondary set of data points or sampling locations.
* **Green square:** A solid, filled region located in the first quadrant (top-right).
* **Spatial Grounding:**
* **Panel 1 (Left):** Dense, uniform distribution.
* **Panel 2 (Middle):** Linear, diagonal distribution.
* **Panel 3 (Right):** Sparse, localized distribution with a region of interest.
### Detailed Analysis
#### Panel 1: Daskalakis et al [DGP09]
* **Visual Trend:** This diagram depicts a high-density, uniform grid.
* **Structure:** A large square array of black dots fills the majority of the space across all four quadrants. Intersecting this grid is a cross-shaped pattern of red triangles, aligned perfectly with the horizontal and vertical axes.
* **Data Distribution:** The sampling is exhaustive, covering the entire coordinate space with high granularity.
#### Panel 2: Chen et al [CDT09]
* **Visual Trend:** This diagram depicts a linear, diagonal progression.
* **Structure:** The sequence begins at the origin (red 'x'). A line of red triangles extends into the first quadrant (top-right) along a 45-degree diagonal. This is followed by a line of black dots continuing along the same diagonal trajectory, moving further away from the origin.
* **Data Distribution:** The sampling is sparse and restricted to a specific vector path.
#### Panel 3: This paper
* **Visual Trend:** This diagram depicts sparse, targeted sampling.
* **Structure:** The origin is marked with a red 'x'. A single red triangle is placed near the origin. Two black dots are positioned further along the diagonal path leading into the first quadrant. A solid green square is centered in the first quadrant, representing a specific region of interest.
* **Data Distribution:** The sampling is highly localized, focusing on a specific area (the green square) rather than the entire space or a full line.
### Key Observations
* **Evolution of Methodology:** The three diagrams illustrate a clear progression in sampling efficiency:
1. **Exhaustive (DGP09):** Covers the entire space.
2. **Path-based (CDT09):** Follows a specific trajectory.
3. **Region-based (This paper):** Focuses on a specific sub-region.
* **Anomalies:** The "This paper" diagram is the only one to include a filled geometric shape (the green square), suggesting a shift from point-based sampling to region-based or "zoom-in" analysis.
### Interpretation
The data suggests these diagrams are conceptual visualizations of algorithms used in computational game theory or numerical analysis—specifically, methods for finding fixed points or Nash equilibria.
* **Daskalakis et al [DGP09]:** Likely represents a grid-based discretization method, which is computationally expensive but thorough.
* **Chen et al [CDT09]:** Likely represents a path-following algorithm (such as the Lemke-Howson algorithm or similar), which traces a specific path to a solution.
* **This paper:** Likely proposes an optimized approach. By identifying a specific region of interest (the green square) and focusing computational resources there, the method likely achieves higher efficiency or precision compared to the exhaustive grid or the linear path-following methods. The sparse points leading to the green square suggest a "coarse-to-fine" or "adaptive" search strategy.