## Diagram: Comparative Visualization of Three Research Approaches
### Overview
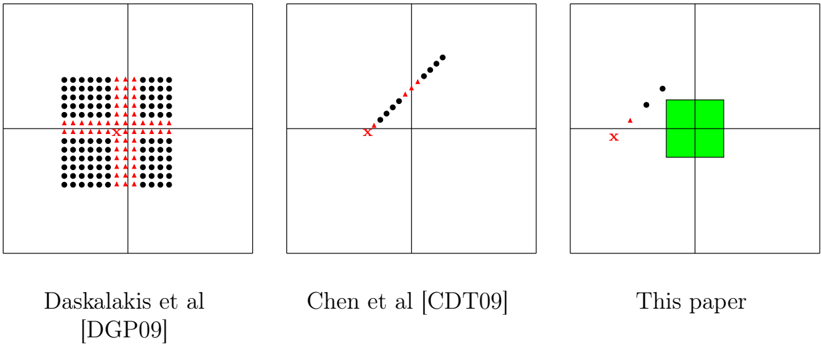
The image presents three side-by-side panels, each labeled with a research paper citation. Each panel contains a grid-based layout with distinct visual elements (dots, triangles, X marks, and a green square) arranged in specific spatial configurations. No numerical data, axes, or legends are explicitly labeled, but the arrangement suggests a conceptual comparison of methodologies or findings.
### Components/Axes
- **Panel 1 (Daskalakis et al [DGP09])**:
- A grid of black dots (likely representing data points or nodes) with red triangles overlaid on the right half.
- A red "X" mark is centered at the intersection of the grid lines.
- **Panel 2 (Chen et al [CDT09])**:
- A diagonal line of black dots extending from the bottom-left to the top-right.
- A red "X" mark is placed at the bottom-left corner of the grid.
- **Panel 3 (This paper)**:
- A green square occupies the right half of the grid.
- Two black dots are positioned above the square, and a red "X" mark is placed at the bottom-left corner.
### Detailed Analysis
- **Panel 1**:
- The grid is divided into four quadrants by horizontal and vertical lines.
- Red triangles are concentrated in the upper-right quadrant, suggesting a focus on specific regions or anomalies.
- The central "X" may indicate a critical point or reference.
- **Panel 2**:
- The diagonal line of dots implies a linear relationship or progression.
- The "X" at the bottom-left could denote an outlier or starting point.
- **Panel 3**:
- The green square is isolated in the right half, possibly representing a key result or region of interest.
- The two black dots above the square might indicate additional data points or secondary findings.
- The "X" at the bottom-left mirrors the placement in Panel 2, suggesting a shared reference point.
### Key Observations
- **Spatial Patterns**:
- Red "X" marks are consistently placed at the bottom-left of Panels 2 and 3, and at the center of Panel 1.
- Red triangles in Panel 1 are concentrated in the upper-right quadrant, contrasting with the uniform distribution of black dots.
- The green square in Panel 3 is the only colored element, drawing attention to its significance.
- **Visual Hierarchy**:
- Panel 1 emphasizes density (many dots) and localized anomalies (triangles).
- Panel 2 highlights a directional trend (diagonal line).
- Panel 3 focuses on a distinct region (green square) with minimal surrounding data.
### Interpretation
The diagram likely compares three research methodologies or findings:
1. **Daskalakis et al [DGP09]** (Panel 1): A grid-based approach with localized anomalies (triangles) and a central reference point (X).
2. **Chen et al [CDT09]** (Panel 2): A linear progression with an outlier (X) at the origin.
3. **This paper** (Panel 3): A focused analysis on a specific region (green square) with secondary data points (dots) and a shared reference (X).
The consistent use of the red "X" across panels suggests a common benchmark or critical value. The green square in Panel 3 may represent a novel or emphasized result, while the red triangles in Panel 1 could indicate areas of divergence or error. The absence of numerical data implies the diagram is conceptual, prioritizing spatial relationships over quantitative metrics.