## Table: Data Transformation
### Overview
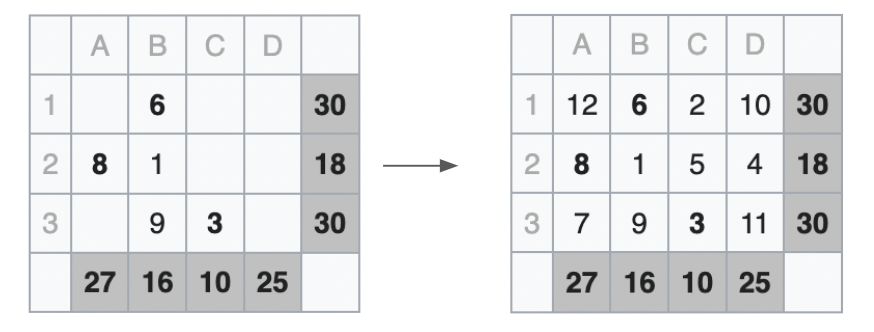
The image shows two tables side-by-side, representing a data transformation process. The table on the left shows the initial state, and the table on the right shows the final state after the transformation. An arrow points from the left table to the right table, indicating the direction of the transformation.
### Components/Axes
Both tables have the same structure:
- **Columns:** Labeled A, B, C, and D.
- **Rows:** Labeled 1, 2, and 3.
- There is an additional row at the bottom that is not numbered.
- Some cells are shaded gray.
### Detailed Analysis or ### Content Details
**Left Table (Initial State):**
| | A | B | C | D |
| :---- | :- | :- | :- | :- |
| **1** | | 6 | | |
| **2** | 8 | 1 | | |
| **3** | | 9 | 3 | |
| | 27 | 16 | 10 | 25 |
| | | | | 30 |
| | | | | 18 |
| | | | | 30 |
- Cell B1 contains the value 6.
- Cell A2 contains the value 8.
- Cell B2 contains the value 1.
- Cell B3 contains the value 9.
- Cell C3 contains the value 3.
- The bottom row (unlabeled) contains the values 27, 16, 10, and 25 in columns A, B, C, and D respectively.
- Cell D1 contains the value 30 and is shaded gray.
- Cell D2 contains the value 18 and is shaded gray.
- Cell D3 contains the value 30 and is shaded gray.
- The bottom row (unlabeled) is shaded gray.
**Right Table (Final State):**
| | A | B | C | D |
| :---- | :- | :- | :- | :- |
| **1** | 12 | 6 | 2 | 10 |
| **2** | 8 | 1 | 5 | 4 |
| **3** | 7 | 9 | 3 | 11 |
| | 27 | 16 | 10 | 25 |
| | | | | 30 |
| | | | | 18 |
| | | | | 30 |
- Cell A1 contains the value 12.
- Cell B1 contains the value 6.
- Cell C1 contains the value 2.
- Cell D1 contains the value 10.
- Cell A2 contains the value 8.
- Cell B2 contains the value 1.
- Cell C2 contains the value 5.
- Cell D2 contains the value 4.
- Cell A3 contains the value 7.
- Cell B3 contains the value 9.
- Cell C3 contains the value 3.
- Cell D3 contains the value 11.
- The bottom row (unlabeled) contains the values 27, 16, 10, and 25 in columns A, B, C, and D respectively and is shaded gray.
- Cell D1 contains the value 30 and is shaded gray.
- Cell D2 contains the value 18 and is shaded gray.
- Cell D3 contains the value 30 and is shaded gray.
- The bottom row (unlabeled) is shaded gray.
### Key Observations
- The values in the bottom row (unlabeled) and column D remain unchanged after the transformation.
- The values in columns A, B, and C in rows 1, 2, and 3 are modified during the transformation.
### Interpretation
The image illustrates a data transformation process applied to a table. The transformation affects only the values in the top-left 3x3 sub-grid, while the values in the bottom row and rightmost column remain constant. This could represent a specific algorithm or rule applied to a subset of the data, while other parts of the data are preserved. The gray shading might indicate that these values are fixed or derived from a different source.