\n
## Data Table: Matrix Transformation
### Overview
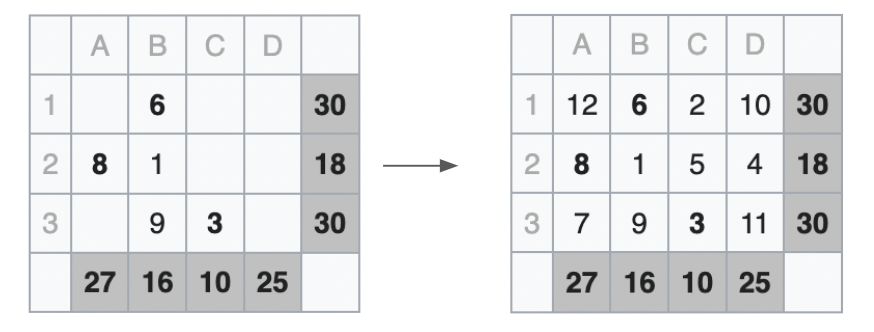
The image presents two 3x4 data tables (matrices) with numerical values. An arrow indicates a transformation from the left table to the right table. Both tables have row labels '1', '2', and '3', and column labels 'A', 'B', 'C', and 'D'. The bottom-right cells of each table contain a sum of the values in their respective rows.
### Components/Axes
* **Rows:** Labeled 1, 2, and 3.
* **Columns:** Labeled A, B, C, and D.
* **Data:** Numerical values within the table cells.
* **Row Sums:** Values in the bottom-right corner of each table, representing the sum of the row values.
### Detailed Analysis or Content Details
**Left Table:**
* Row 1: A = 6, B = N/A, C = N/A, D = 30. Row Sum = 27
* Row 2: A = 8, B = 1, C = N/A, D = 18. Row Sum = 16
* Row 3: A = 9, B = 3, C = N/A, D = 30. Row Sum = 10
* Column Totals: A = 27, B = 16, C = 10, D = 25
**Right Table:**
* Row 1: A = 12, B = 6, C = 2, D = 30. Row Sum = 27
* Row 2: A = 8, B = 1, C = 5, D = 18. Row Sum = 16
* Row 3: A = 7, B = 9, C = 3, D = 30. Row Sum = 10
* Column Totals: A = 27, B = 16, C = 10, D = 25
**Transformation:**
* The transformation appears to involve adding values to specific cells.
* A1: 6 -> 12 (+6)
* B1: N/A -> 6 (+6)
* C1: N/A -> 2 (+2)
* A2: 8 -> 8 (+0)
* B2: 1 -> 1 (+0)
* C2: N/A -> 5 (+5)
* A3: 9 -> 7 (-2)
* B3: 3 -> 9 (+6)
* C3: N/A -> 3 (+3)
### Key Observations
* The row sums remain constant throughout the transformation.
* The column sums remain constant throughout the transformation.
* The transformation appears to be adding values to the first and second rows, and modifying the third row.
* The transformation fills in the missing values in the first table.
### Interpretation
The image demonstrates a matrix transformation that preserves row and column sums. This suggests a possible application in linear algebra or data manipulation where maintaining certain constraints (like sums) is crucial. The transformation could represent a redistribution of values within the matrix while keeping the overall totals constant. The filling of the missing values in the second table suggests a completion or imputation process. The specific pattern of additions and subtractions could be related to a defined mathematical operation or a specific data processing rule.