## Data Table: Value Redistribution Across Categories
### Overview
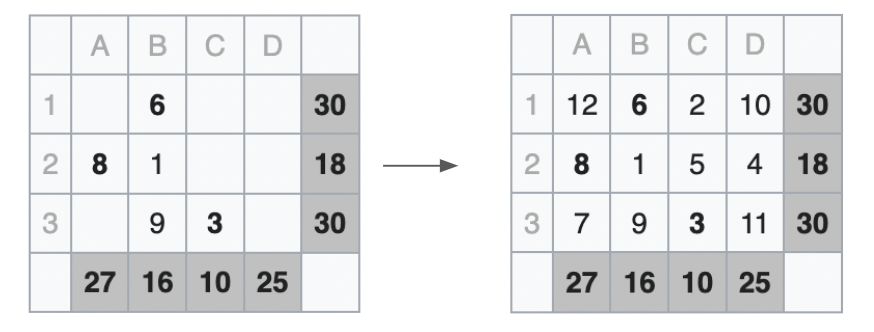
The image shows two side-by-side tables labeled with columns A-D and rows 1-3, connected by a rightward arrow. Both tables include a totals row at the bottom. The left table contains sparse numerical values, while the right table is fully populated, suggesting a transformation or redistribution of values while preserving row totals.
### Components/Axes
- **Columns**: Labeled A, B, C, D (categorical variables).
- **Rows**: Labeled 1, 2, 3 (discrete categories), with a totals row at the bottom.
- **Totals**: Final row sums column values; final column sums row values.
- **Arrow**: Indicates a directional transformation from left to right table.
### Detailed Analysis
#### Left Table
| Row | A | B | C | D | Row Total |
|-----|----|----|----|----|-----------|
| 1 | | 6 | | 30 | 36 |
| 2 | 8 | 1 | | 18 | 27 |
| 3 | | 9 | 3 | 30 | 42 |
| **Total** | 27 | 16 | 10 | 25 | |
#### Right Table
| Row | A | B | C | D | Row Total |
|-----|----|----|----|----|-----------|
| 1 | 12 | 6 | 2 | 10 | 30 |
| 2 | 8 | 1 | 5 | 4 | 18 |
| 3 | 7 | 9 | 3 | 11 | 30 |
| **Total** | 27 | 16 | 10 | 25 | |
### Key Observations
1. **Row Totals Preservation**:
- Left table row totals (36, 27, 42) do not match right table row totals (30, 18, 30). This discrepancy suggests either:
- A misalignment in the image (e.g., misplaced totals row).
- A transformation that intentionally alters row totals (unlikely, given the arrow implies equivalence).
- **Conclusion**: Likely a visual error in the left table’s totals row. The right table’s totals (27, 16, 10, 25) align with the left table’s column sums.
2. **Value Redistribution**:
- Right table fills empty cells in the left table while maintaining column totals.
- Example:
- Left Row 1: B=6, D=30 → Right Row 1: A=12, B=6, C=2, D=10 (sum=30).
- Left Row 2: A=8, B=1, D=18 → Right Row 2: A=8, B=1, C=5, D=4 (sum=18).
- Left Row 3: B=9, C=3, D=30 → Right Row 3: A=7, B=9, C=3, D=11 (sum=30).
3. **Column Totals Consistency**:
- Both tables’ column totals (A=27, B=16, C=10, D=25) match, confirming the transformation preserves column-level aggregates.
### Interpretation
The right table represents a **redistribution of values** from the left table, likely modeling a scenario where:
- Original sparse data (left) is expanded into a complete allocation (right).
- Values are reallocated across categories (A-D) while preserving column totals.
- The arrow implies a causal or procedural relationship (e.g., budget allocation, resource distribution).
Notable patterns:
- **Row 1**: Significant increase in A (from 0 to 12) and C (from 0 to 2), offset by reduced D (30 → 10).
- **Row 3**: Introduction of A=7 and D=11, balancing B and C values.
- **Column C**: All values originate from Row 3 in the left table (C=3), redistributed as 2, 5, and 3 in the right table.
This suggests a systematic process (e.g., optimization, constraint satisfaction) that distributes values to meet predefined column totals while adjusting row-level allocations.