## Knowledge Graph and Reasoning Diagram
### Overview
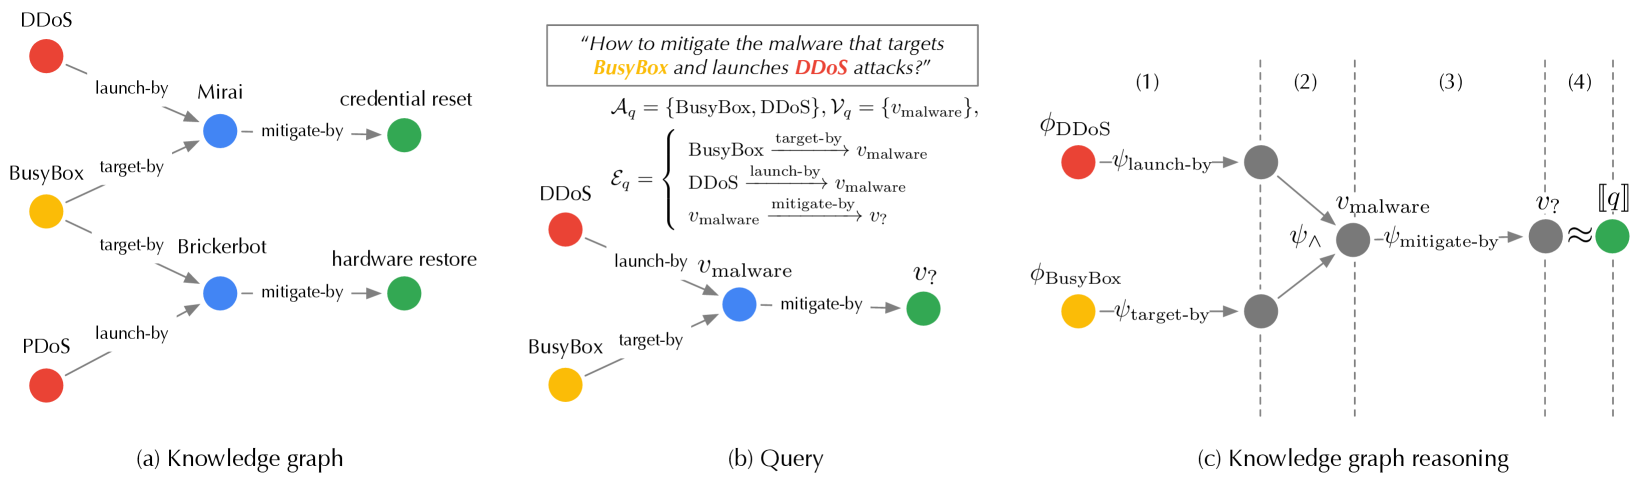
The image presents three diagrams: a knowledge graph, a query graph, and a knowledge graph reasoning process. These diagrams illustrate how to mitigate malware targeting BusyBox and launching DDoS attacks. The diagrams use nodes and edges to represent entities and their relationships.
### Components/Axes
**(a) Knowledge Graph:**
* **Nodes:** Represented by colored circles.
* Red: DDoS, PDDoS
* Yellow: BusyBox
* Blue: Mirai, Brickerbot
* Green: credential reset, hardware restore
* **Edges:** Represented by gray lines with arrows, indicating relationships between nodes.
* launch-by: Indicates which entity launches another.
* target-by: Indicates which entity is targeted by another.
* mitigate-by: Indicates how an entity is mitigated.
**(b) Query:**
* **Text Box (Top):** Contains the query: "How to mitigate the malware that targets BusyBox and launches DDoS attacks?"
* **Sets:**
* `A_q = {BusyBox, DDoS}`: Set of anchor nodes in the query.
* `V_q = {v_malware}`: Set of variable nodes in the query.
* **Edges (E_q):** Defined as a set of relationships:
* `BusyBox target-by v_malware`
* `DDoS launch-by v_malware`
* `v_malware mitigate-by v?`
* **Nodes:** Represented by colored circles.
* Red: DDoS
* Yellow: BusyBox
* Blue: v_malware
* Green: v?
* **Edges:** Represented by gray lines with arrows, indicating relationships between nodes.
* launch-by: Indicates which entity launches another.
* target-by: Indicates which entity is targeted by another.
* mitigate-by: Indicates how an entity is mitigated.
**(c) Knowledge Graph Reasoning:**
* **Nodes:** Represented by colored circles.
* Red: φDDoS
* Yellow: φBusyBox
* Gray: Intermediate nodes
* Green: [q]
* **Edges:** Represented by gray lines with arrows, indicating relationships between nodes.
* ψ_launch-by
* ψ_target-by
* ψ_mitigate-by
* ψ_∧
* ≈
* **Vertical Dashed Lines:** Divide the diagram into four sections labeled (1), (2), (3), and (4).
### Detailed Analysis or Content Details
**(a) Knowledge Graph:**
* DDoS (red) launch-by Mirai (blue). Mirai (blue) mitigate-by credential reset (green).
* BusyBox (yellow) target-by Brickerbot (blue). Brickerbot (blue) mitigate-by hardware restore (green).
* PDDoS (red) launch-by v_malware (blue).
**(b) Query:**
* The query seeks to find the mitigation strategies for malware that targets BusyBox and launches DDoS attacks.
* DDoS (red) launch-by v_malware (blue).
* BusyBox (yellow) target-by v_malware (blue).
* v_malware (blue) mitigate-by v? (green).
**(c) Knowledge Graph Reasoning:**
* **Section (1):** φDDoS (red) and φBusyBox (yellow) are the starting points.
* **Section (2):** φDDoS launch-by a gray node, and φBusyBox target-by the same gray node. These two gray nodes converge to v_malware (gray) via ψ_∧.
* **Section (3):** v_malware (gray) mitigate-by another gray node.
* **Section (4):** The gray node from section (3) is approximately equal (≈) to [q] (green).
### Key Observations
* The knowledge graph shows relationships between different entities involved in cyberattacks and their mitigation.
* The query graph formalizes the question of how to mitigate malware targeting BusyBox and launching DDoS attacks.
* The knowledge graph reasoning diagram illustrates the process of finding the answer to the query by traversing the knowledge graph.
### Interpretation
The diagrams collectively demonstrate a knowledge-based approach to cybersecurity. The knowledge graph stores information about malware, targets, and mitigation strategies. The query graph allows users to ask specific questions about these relationships. The knowledge graph reasoning process uses the knowledge graph to answer the query. This approach can be used to automate the process of finding mitigation strategies for cyberattacks. The diagrams highlight the relationships between different types of malware, the systems they target, and the methods used to mitigate them. The reasoning process shows how to find potential mitigation strategies by traversing the graph of known relationships.