## Bar Chart: Drop in AUROC for Different Question Answering Datasets
### Overview
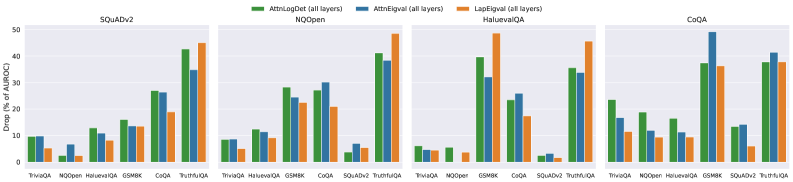
The image presents a series of bar charts comparing the drop in Area Under the Receiver Operating Characteristic Curve (AUROC) for different question answering datasets when using three different methods: AttnLogDet, AttnEigval, and LapEigval. The charts are grouped by dataset: SQuADv2, NQOpen, HaluevalQA, and CoQA. Each group shows the AUROC drop for various question types within that dataset.
### Components/Axes
* **Y-axis:** "Drop (% of AUROC)" with a scale from 0 to 50, incrementing by 10.
* **X-axis:** Question types within each dataset (TriviaQA, NQOpen, HaluevalQA, GSMBK, CoQA, SQuADv2, TruthfulQA, NOOper). Note that not all question types are present in each dataset group.
* **Legend:** Located at the top of the chart.
* Green: AttnLogDet (all layers)
* Blue: AttnEigval (all layers)
* Orange: LapEigval (all layers)
* **Chart Titles:**
* Top-left: SQuADv2
* Top-middle-left: NQOpen
* Top-middle-right: HaluevalQA
* Top-right: CoQA
### Detailed Analysis
**SQuADv2 Dataset:**
* TriviaQA: AttnLogDet ~9%, AttnEigval ~8%, LapEigval ~5%
* NQOpen: AttnLogDet ~2%, AttnEigval ~6%, LapEigval ~2%
* HaluevalQA: AttnLogDet ~12%, AttnEigval ~11%, LapEigval ~8%
* GSMBK: AttnLogDet ~15%, AttnEigval ~13%, LapEigval ~13%
* CoQA: AttnLogDet ~26%, AttnEigval ~26%, LapEigval ~18%
* TruthfulQA: AttnLogDet ~42%, AttnEigval ~30%, LapEigval ~19%
**NQOpen Dataset:**
* TriviaQA: AttnLogDet ~9%, AttnEigval ~9%, LapEigval ~4%
* HaluevalQA: AttnLogDet ~13%, AttnEigval ~12%, LapEigval ~9%
* GSMBK: AttnLogDet ~22%, AttnEigval ~21%, LapEigval ~17%
* CoQA: AttnLogDet ~38%, AttnEigval ~32%, LapEigval ~26%
* SQuADv2: AttnLogDet ~3%, AttnEigval ~7%, LapEigval ~3%
* TruthfulQA: AttnLogDet ~43%, AttnEigval ~33%, LapEigval ~29%
**HaluevalQA Dataset:**
* TriviaQA: AttnLogDet ~5%, AttnEigval ~5%, LapEigval ~5%
* NOOper: AttnLogDet ~2%, AttnEigval ~1%, LapEigval ~1%
* GSMBK: AttnLogDet ~36%, AttnEigval ~17%, LapEigval ~13%
* CoQA: AttnLogDet ~37%, AttnEigval ~22%, LapEigval ~17%
* SQuADv2: AttnLogDet ~2%, AttnEigval ~13%, LapEigval ~2%
* TruthfulQA: AttnLogDet ~37%, AttnEigval ~22%, LapEigval ~45%
**CoQA Dataset:**
* TriviaQA: AttnLogDet ~17%, AttnEigval ~12%, LapEigval ~9%
* NQOpen: AttnLogDet ~16%, AttnEigval ~10%, LapEigval ~7%
* HaluevalQA: AttnLogDet ~15%, AttnEigval ~10%, LapEigval ~7%
* GSMBK: AttnLogDet ~37%, AttnEigval ~47%, LapEigval ~32%
* SQuADv2: AttnLogDet ~15%, AttnEigval ~14%, LapEigval ~4%
* TruthfulQA: AttnLogDet ~38%, AttnEigval ~38%, LapEigval ~35%
### Key Observations
* The drop in AUROC varies significantly across different question types and datasets.
* AttnLogDet generally shows a higher drop in AUROC compared to AttnEigval and LapEigval, especially for TruthfulQA in SQuADv2 and NQOpen datasets.
* LapEigval often exhibits the lowest drop in AUROC, suggesting it might be more robust to certain types of questions.
* GSMBK and TruthfulQA questions tend to have a higher drop in AUROC compared to TriviaQA and NQOpen questions.
### Interpretation
The bar charts illustrate the impact of different attention mechanisms (AttnLogDet, AttnEigval, and LapEigval) on the performance of question answering models, as measured by the drop in AUROC. The data suggests that the choice of attention mechanism can significantly affect performance, depending on the type of question and the dataset used. AttnLogDet appears to be more sensitive to certain question types, leading to a larger performance drop. The relative consistency of LapEigval suggests it might be a more stable choice across different question types. The higher drop in AUROC for GSMBK and TruthfulQA questions indicates that these question types may be more challenging for the models to answer correctly, regardless of the attention mechanism used. The data highlights the importance of carefully selecting and tuning attention mechanisms for specific question answering tasks and datasets.