## Line Graphs: Jacobian Norm Trends Across Epochs for Layer 2 and Layer 12
### Overview
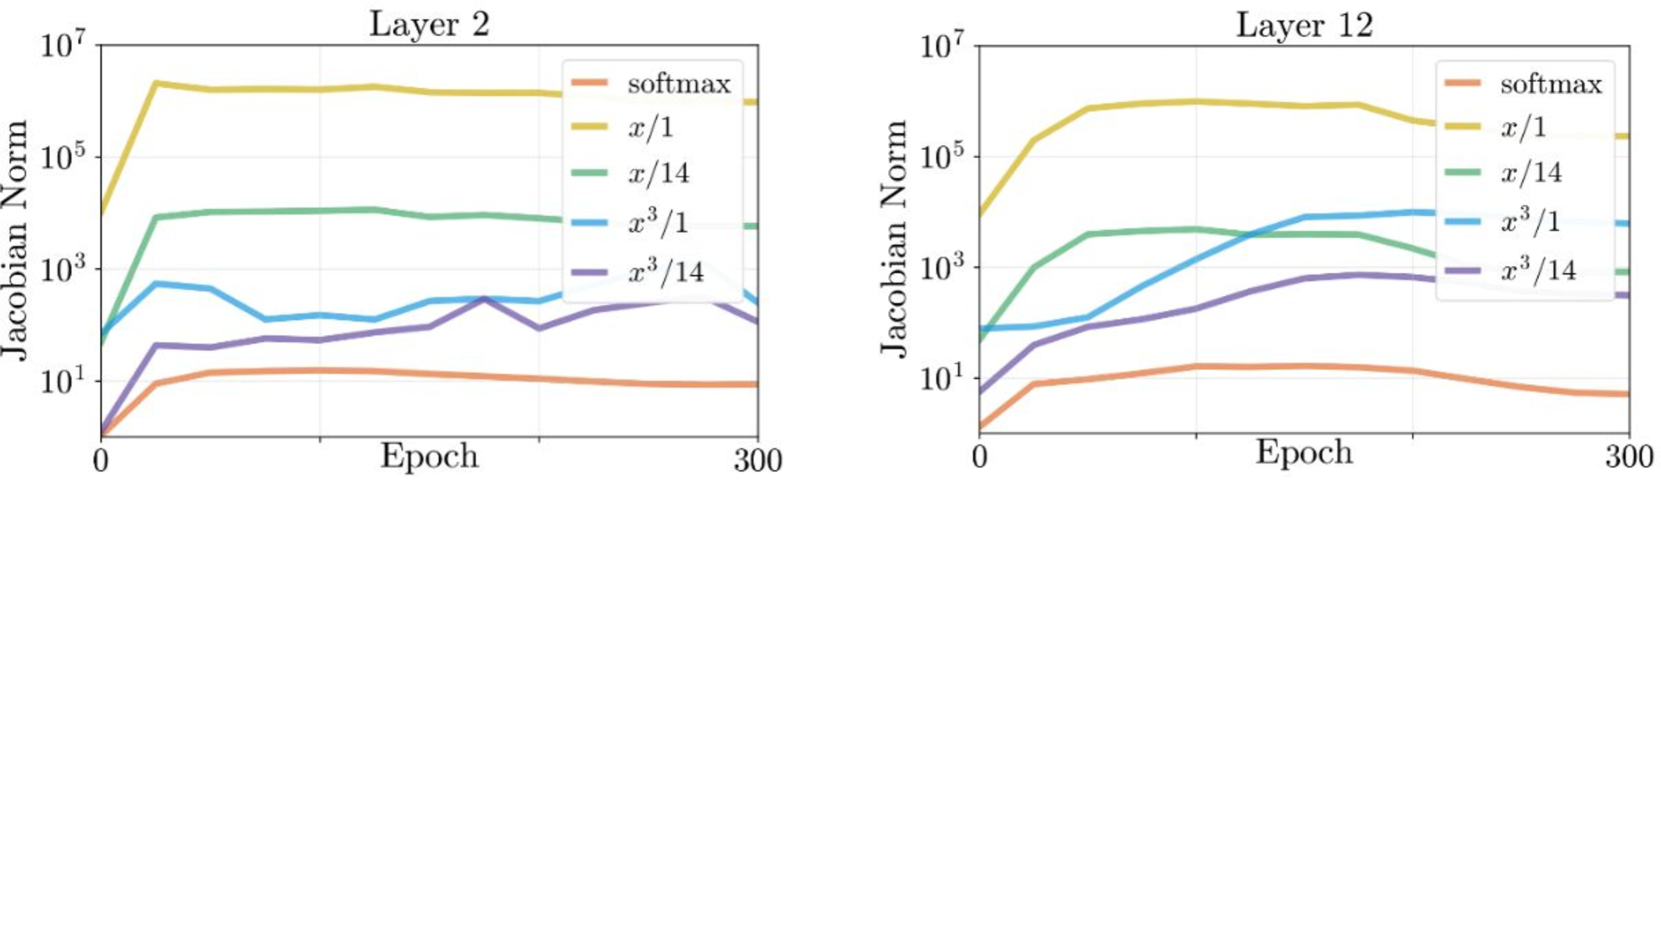
The image contains two line graphs comparing the Jacobian norm (logarithmic scale) across 300 epochs for two neural network layers (Layer 2 and Layer 12). Each graph includes five data series representing different scaling strategies: softmax, x/1, x/14, x³/1, and x³/14. The y-axis ranges from 10¹ to 10⁷, and the x-axis spans 0 to 300 epochs.
---
### Components/Axes
- **X-axis**: "Epoch" (0 to 300, linear scale).
- **Y-axis**: "Jacobian Norm" (logarithmic scale: 10¹ to 10⁷).
- **Legends**: Positioned to the right of each graph, with color-coded labels:
- **Orange**: softmax
- **Yellow**: x/1
- **Green**: x/14
- **Blue**: x³/1
- **Purple**: x³/14
---
### Detailed Analysis
#### Layer 2
- **Yellow (x/1)**: Starts at ~10⁶, remains stable with minor fluctuations (~10⁶ ± 10⁵).
- **Green (x/14)**: Begins at ~10³, stays relatively flat (~10³ ± 10²).
- **Blue (x³/1)**: Starts at ~10¹, peaks at ~10³ at epoch 100, then drops to ~10² by epoch 300.
- **Purple (x³/14)**: Starts at ~10⁰, peaks at ~10² at epoch 100, then declines to ~10¹.
- **Orange (softmax)**: Remains near 10⁰ throughout, with slight fluctuations (~10⁰ ± 10⁻¹).
#### Layer 12
- **Yellow (x/1)**: Starts at ~10⁵, peaks at ~10⁶ at epoch 50, then drops to ~10⁵ by epoch 300.
- **Green (x/14)**: Begins at ~10², peaks at ~10³ at epoch 100, then declines to ~10².
- **Blue (x³/1)**: Starts at ~10¹, peaks at ~10⁴ at epoch 150, then drops to ~10³.
- **Purple (x³/14)**: Starts at ~10⁰, peaks at ~10² at epoch 150, then declines to ~10¹.
- **Orange (softmax)**: Remains near 10⁰, with minor fluctuations (~10⁰ ± 10⁻¹).
---
### Key Observations
1. **Layer 2**:
- **x/1** (yellow) shows the highest and most stable Jacobian norm.
- **x³/1** (blue) and **x³/14** (purple) exhibit sharp peaks followed by declines, suggesting transient instability.
- **softmax** (orange) remains the most stable, with minimal variation.
2. **Layer 12**:
- **x/1** (yellow) has a pronounced peak at epoch 50, indicating a transient instability.
- **x³/1** (blue) and **x³/14** (purple) show larger peaks and sharper declines compared to Layer 2.
- **softmax** (orange) remains stable in both layers.
---
### Interpretation
- **Scaling Impact**: The x/1 scaling (yellow) in Layer 12 exhibits a significant peak, suggesting sensitivity to initial training dynamics. In contrast, Layer 2’s x/1 remains stable, possibly due to differences in layer architecture or training data.
- **x³ Scaling**: Both x³/1 and x³/14 show initial growth followed by decay, implying overfitting or instability during early epochs. The decay may reflect regularization effects or parameter saturation.
- **softmax Stability**: The flat orange lines in both layers suggest that the softmax function’s Jacobian norm is less sensitive to scaling changes, making it a stable choice for gradient-based optimization.
- **Layer-Specific Behavior**: Layer 12’s higher variability (e.g., x/1 peak at 10⁶ vs. Layer 2’s 10⁶) may reflect differences in layer depth, connectivity, or training objectives.
---
### Spatial Grounding
- **Legends**: Right-aligned for both graphs, with colors matching line styles.
- **Axes**: Y-axis (log scale) on the left, X-axis (linear) at the bottom.
- **Line Placement**: Each data series occupies distinct vertical ranges, with Layer 12’s x³/1 (blue) reaching the highest peak (~10⁴) compared to Layer 2’s x³/1 (~10³).
---
### Content Details
- **Layer 2**:
- **x/1**: ~10⁶ (epoch 0–300).
- **x/14**: ~10³ (epoch 0–300).
- **x³/1**: Peaks at ~10³ (epoch 100), drops to ~10² (epoch 300).
- **x³/14**: Peaks at ~10² (epoch 100), drops to ~10¹ (epoch 300).
- **softmax**: ~10⁰ (epoch 0–300).
- **Layer 12**:
- **x/1**: Peaks at ~10⁶ (epoch 50), drops to ~10⁵ (epoch 300).
- **x/14**: Peaks at ~10³ (epoch 100), drops to ~10² (epoch 300).
- **x³/1**: Peaks at ~10⁴ (epoch 150), drops to ~10³ (epoch 300).
- **x³/14**: Peaks at ~10² (epoch 150), drops to ~10¹ (epoch 300).
- **softmax**: ~10⁰ (epoch 0–300).