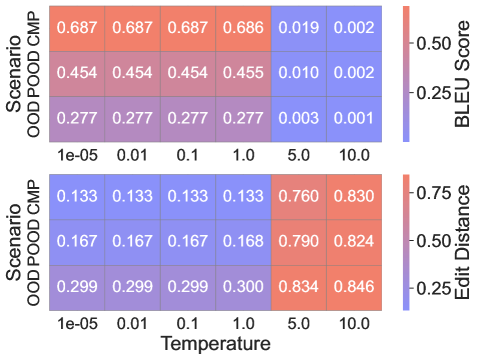
## Heatmap: BLEU Score and Edit Distance vs. Temperature for Different Scenarios
### Overview
The image presents two heatmaps arranged vertically. The top heatmap visualizes BLEU scores for different scenarios across varying temperatures. The bottom heatmap visualizes Edit Distance for the same scenarios and temperatures. The x-axis represents temperature, and the y-axis represents different scenarios (OOD, POOD, CMP). Color intensity corresponds to the score/distance value, with a color gradient legend provided on the right side of each heatmap.
### Components/Axes
* **X-axis (shared):** Temperature, with values: 1e-05, 0.01, 0.1, 1.0, 5.0, 10.0
* **Y-axis (top):** Scenario (BLEU Score), with categories: OOD, POOD, CMP
* **Y-axis (bottom):** Scenario (Edit Distance), with categories: OOD, POOD, CMP
* **Color Legend (right, top):** BLEU Score, ranging from approximately 0.0 (dark blue) to 0.75 (red). The legend shows markers at 0.25 and 0.50.
* **Color Legend (right, bottom):** Edit Distance, ranging from approximately 0.0 (dark blue) to 1.0 (red). The legend shows markers at 0.25, 0.50, and 0.75.
### Detailed Analysis
**Top Heatmap: BLEU Score**
* **Scenario CMP:** The BLEU score is high (approximately 0.68) for temperatures 1e-05, 0.01, 0.1, and 1.0. It drops significantly to 0.019 at temperature 5.0 and further to 0.002 at temperature 10.0.
* **Scenario POOD:** The BLEU score is moderate (approximately 0.45) for temperatures 1e-05, 0.01, 0.1, and 1.0. It drops significantly to 0.010 at temperature 5.0 and further to 0.002 at temperature 10.0.
* **Scenario OOD:** The BLEU score is low (approximately 0.27) for temperatures 1e-05, 0.01, 0.1, and 1.0. It drops significantly to 0.003 at temperature 5.0 and further to 0.001 at temperature 10.0.
**Bottom Heatmap: Edit Distance**
* **Scenario CMP:** The Edit Distance is low (approximately 0.13) for temperatures 1e-05, 0.01, 0.1, and 1.0. It increases significantly to 0.760 at temperature 5.0 and further to 0.830 at temperature 10.0.
* **Scenario POOD:** The Edit Distance is low (approximately 0.167) for temperatures 1e-05, 0.01, 0.1, and 1.0. It increases significantly to 0.790 at temperature 5.0 and further to 0.824 at temperature 10.0.
* **Scenario OOD:** The Edit Distance is low (approximately 0.299) for temperatures 1e-05, 0.01, 0.1, and 1.0. It increases significantly to 0.834 at temperature 5.0 and further to 0.846 at temperature 10.0.
### Key Observations
* For BLEU score, all scenarios (CMP, POOD, OOD) show a high score at low temperatures (1e-05 to 1.0) and a drastic drop at higher temperatures (5.0 and 10.0).
* For Edit Distance, all scenarios (CMP, POOD, OOD) show a low distance at low temperatures (1e-05 to 1.0) and a significant increase at higher temperatures (5.0 and 10.0).
* The BLEU score is highest for CMP and lowest for OOD across the lower temperature range.
* The Edit Distance is lowest for CMP and highest for OOD across the lower temperature range.
### Interpretation
The heatmaps suggest an inverse relationship between temperature and model performance, as measured by BLEU score, and a direct relationship between temperature and Edit Distance. At lower temperatures (1e-05 to 1.0), the models perform relatively well, with higher BLEU scores and lower Edit Distances. However, as the temperature increases (5.0 and 10.0), the performance degrades significantly, indicated by the sharp drop in BLEU scores and the substantial increase in Edit Distances.
The different scenarios (CMP, POOD, OOD) also exhibit varying levels of performance. CMP consistently shows the best performance (highest BLEU score, lowest Edit Distance), while OOD shows the worst performance (lowest BLEU score, highest Edit Distance). This suggests that the model is better suited for the CMP scenario compared to the OOD scenario. The POOD scenario falls in between CMP and OOD in terms of performance.
The data implies that a lower temperature is preferable for optimal model performance, and that the model's effectiveness is highly dependent on the specific scenario. The drastic change in performance at higher temperatures warrants further investigation into the model's behavior and potential overfitting or instability at those temperature settings.