## Heatmap: BLEU Score and Edit Distance vs. Temperature
### Overview
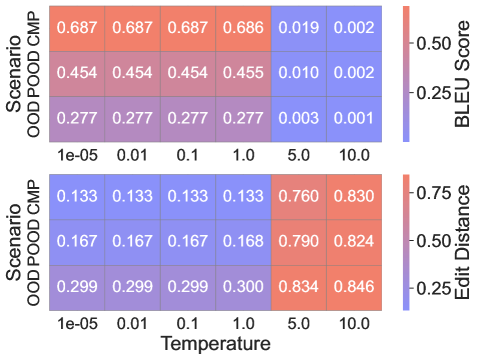
This image displays two stacked heatmaps illustrating the performance of a model under different "Temperature" settings. The top heatmap measures "BLEU Score," while the bottom heatmap measures "Edit Distance." Both charts share the same X-axis (Temperature) and Y-axis (Scenario OOD POOD CMP). The data indicates a distinct performance threshold between a Temperature of 1.0 and 5.0.
### Components/Axes
* **X-Axis (Bottom of both charts):** Temperature. Values: `1e-05`, `0.01`, `0.1`, `1.0`, `5.0`, `10.0`.
* **Y-Axis (Left of both charts):** "Scenario OOD POOD CMP". This label applies to the three rows in each heatmap.
* **Legends (Right of each chart):**
* **Top Legend (BLEU Score):** A gradient scale from Blue (low, ~0.0) to Red (high, ~0.50+).
* **Bottom Legend (Edit Distance):** A gradient scale from Blue (low, ~0.25) to Red (high, ~0.75+).
### Detailed Analysis
#### Top Chart: BLEU Score
* **Trend:** The BLEU score remains relatively stable and high (Red) for temperatures 1e-05 through 1.0. There is a sharp, drastic drop to near-zero (Blue) at temperatures 5.0 and 10.0.
* **Data Points (Rows 1-3, Columns 1-6):**
* **Row 1:** 0.687, 0.687, 0.687, 0.686, 0.019, 0.002
* **Row 2:** 0.454, 0.454, 0.454, 0.455, 0.010, 0.002
* **Row 3:** 0.277, 0.277, 0.277, 0.277, 0.003, 0.001
#### Bottom Chart: Edit Distance
* **Trend:** The Edit Distance remains relatively stable and low (Blue) for temperatures 1e-05 through 1.0. There is a sharp, drastic increase to high values (Red) at temperatures 5.0 and 10.0.
* **Data Points (Rows 1-3, Columns 1-6):**
* **Row 1:** 0.133, 0.133, 0.133, 0.133, 0.760, 0.830
* **Row 2:** 0.167, 0.167, 0.167, 0.168, 0.790, 0.824
* **Row 3:** 0.299, 0.299, 0.299, 0.300, 0.834, 0.846
### Key Observations
* **Threshold Effect:** Both metrics show a clear "cliff" or transition point between Temperature 1.0 and 5.0.
* **Inverse Relationship:** As Temperature increases beyond 1.0, the BLEU score (a measure of similarity to reference text) collapses, while the Edit Distance (a measure of dissimilarity) spikes.
* **Consistency:** The three rows in each chart exhibit very similar behavior across the temperature spectrum, suggesting that the "Scenario" variations do not alter the fundamental impact of the Temperature parameter on model output quality.
### Interpretation
The data demonstrates that the "Temperature" parameter acts as a critical control for model output quality.
* **Low Temperature (<= 1.0):** The model produces high-quality, relevant output, characterized by high BLEU scores and low Edit Distance. This is the optimal operating range.
* **High Temperature (>= 5.0):** The model's output quality degrades significantly. The near-zero BLEU scores and high Edit Distance suggest that at these temperatures, the model is likely generating incoherent, repetitive, or completely irrelevant text that bears little resemblance to the target or reference data.
The sharp transition suggests that the model's generation mechanism becomes unstable or "hallucinatory" when the temperature exceeds 1.0, rendering the output unusable for tasks requiring high fidelity to a reference.