## Heatmap Analysis: BLEU Score and Edit Distance vs. Temperature
### Overview
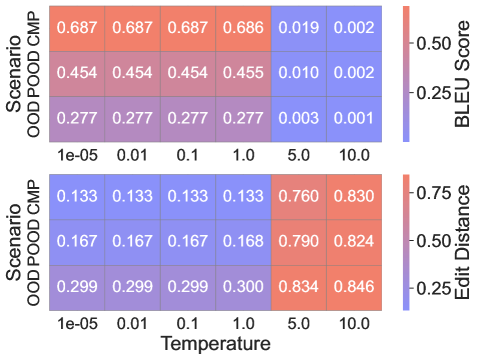
The image displays two vertically stacked heatmaps that visualize the relationship between a "Temperature" parameter (x-axis) and three different "Scenarios" (y-axis) for two distinct performance metrics. The top heatmap measures **BLEU Score**, and the bottom heatmap measures **Edit Distance**. The data suggests an inverse relationship between the two metrics as temperature increases.
### Components/Axes
**Shared Elements:**
* **X-axis (Bottom):** Labeled "Temperature". It has six discrete, logarithmically spaced values: `1e-05`, `0.01`, `0.1`, `1.0`, `5.0`, `10.0`.
* **Y-axis (Left):** Labeled "Scenario". It lists three categories from top to bottom: `CMP`, `POOD`, `OOD`.
* **Color Bars (Right):** Each heatmap has its own vertical color bar legend.
* **Top (BLEU Score):** Scale ranges from approximately `0.001` (dark blue) to `0.687` (dark red). Key markers: `0.001`, `0.25`, `0.50`.
* **Bottom (Edit Distance):** Scale ranges from approximately `0.133` (dark blue) to `0.846` (dark red). Key markers: `0.25`, `0.50`, `0.75`.
**Top Heatmap: BLEU Score**
* **Title/Metric:** "BLEU Score" (label on the color bar).
* **Data Grid:** A 3x6 grid of colored cells, each containing a numerical value.
**Bottom Heatmap: Edit Distance**
* **Title/Metric:** "Edit Distance" (label on the color bar).
* **Data Grid:** A 3x6 grid of colored cells, each containing a numerical value.
### Detailed Analysis
**Top Heatmap: BLEU Score Data**
* **Trend Verification:** For all three scenarios (CMP, POOD, OOD), the BLEU score remains stable and relatively high for temperatures from `1e-05` to `1.0`. There is a **sharp, significant drop** in score at temperatures `5.0` and `10.0`.
* **Data Points (Row by Row):**
* **CMP (Top Row):** `0.687`, `0.687`, `0.687`, `0.686`, `0.019`, `0.002`.
* **POOD (Middle Row):** `0.454`, `0.454`, `0.454`, `0.455`, `0.010`, `0.002`.
* **OOD (Bottom Row):** `0.277`, `0.277`, `0.277`, `0.277`, `0.003`, `0.001`.
* **Spatial Grounding:** The highest BLEU scores (dark red cells, ~0.687) are located in the top-left region (CMP scenario, low temperatures). The lowest scores (dark blue cells, ~0.001) are in the bottom-right region (OOD scenario, high temperatures).
**Bottom Heatmap: Edit Distance Data**
* **Trend Verification:** For all three scenarios, the Edit Distance remains stable and relatively low for temperatures from `1e-05` to `1.0`. There is a **sharp, significant increase** in distance at temperatures `5.0` and `10.0`.
* **Data Points (Row by Row):**
* **CMP (Top Row):** `0.133`, `0.133`, `0.133`, `0.133`, `0.760`, `0.830`.
* **POOD (Middle Row):** `0.167`, `0.167`, `0.167`, `0.168`, `0.790`, `0.824`.
* **OOD (Bottom Row):** `0.299`, `0.299`, `0.299`, `0.300`, `0.834`, `0.846`.
* **Spatial Grounding:** The lowest Edit Distance values (dark blue cells, ~0.133) are in the top-left region (CMP, low temperatures). The highest values (dark red cells, ~0.846) are in the bottom-right region (OOD, high temperatures).
### Key Observations
1. **Inverse Correlation:** There is a clear inverse relationship between BLEU Score and Edit Distance. As one metric degrades (BLEU drops), the other worsens (Edit Distance increases).
2. **Critical Threshold:** A performance phase transition occurs between Temperature `1.0` and `5.0`. Performance is stable for T ≤ 1.0 and degrades sharply for T ≥ 5.0.
3. **Scenario Hierarchy:** At low temperatures (T ≤ 1.0), a consistent hierarchy exists:
* **BLEU Score:** `CMP` > `POOD` > `OOD`.
* **Edit Distance:** `CMP` < `POOD` < `OOD` (lower is better).
This suggests the `CMP` scenario yields the best baseline performance, followed by `POOD`, then `OOD`.
4. **Convergence at High Temperature:** At high temperatures (T ≥ 5.0), the performance of all scenarios converges to similarly poor levels for both metrics, though the hierarchical ordering is largely preserved.
### Interpretation
This data likely comes from an experiment evaluating a text generation or translation model's performance under different conditions. "Temperature" is a common parameter controlling randomness in model outputs.
* **What the data suggests:** Low temperature settings (≤ 1.0) produce outputs that are more similar to reference texts (higher BLEU) and require fewer edits (lower Edit Distance). High temperature settings (≥ 5.0) cause the model to generate text that diverges significantly from references, resulting in low similarity and high required edits.
* **Relationship between elements:** The two heatmaps are two sides of the same coin. BLEU Score measures n-gram overlap (similarity), while Edit Distance measures the number of operations needed to transform one text into another (dissimilarity). Their inverse correlation here is a logical validation of the metrics.
* **Notable Anomaly/Insight:** The stability of performance across a wide range of low temperatures (from 0.00001 to 1.0) is striking. It indicates the model's output quality is robust within this regime. The catastrophic drop at T=5.0 suggests a critical point where the model's sampling distribution becomes too diffuse, leading to incoherent or off-topic outputs.
* **Peircean Investigation:** The sign (the heatmap pattern) indicates that the model's behavior undergoes a fundamental shift. The icon (the sharp value change) points to a threshold effect. The interpretant (the conclusion) is that for reliable, high-quality output, the temperature must be kept at or below 1.0 for this particular model and task. The `OOD` scenario is the most sensitive, showing the lowest baseline performance and the highest final edit distance.