## Chart: Distribution of Reward Function and Accuracy on Human Reward Function Set
### Overview
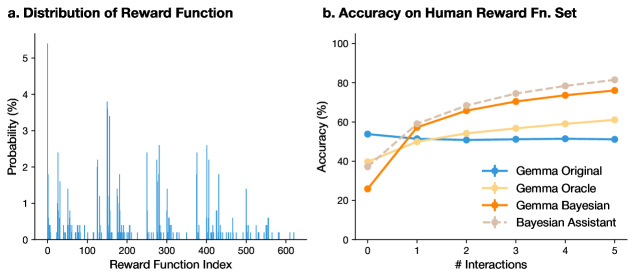
The image presents two charts. The first chart (a) is a bar graph showing the distribution of a reward function across different reward function indices. The second chart (b) is a line graph comparing the accuracy of different models (Gemma Original, Gemma Oracle, Gemma Bayesian, and Bayesian Assistant) on a human reward function set, plotted against the number of interactions.
### Components/Axes
**Chart a: Distribution of Reward Function**
* **Title:** a. Distribution of Reward Function
* **X-axis:** Reward Function Index, ranging from 0 to 600.
* **Y-axis:** Probability (%), ranging from 0% to 5%.
* **Data:** The chart displays a series of vertical bars, each representing the probability associated with a specific reward function index.
**Chart b: Accuracy on Human Reward Fn. Set**
* **Title:** b. Accuracy on Human Reward Fn. Set
* **X-axis:** # Interactions, ranging from 0 to 5.
* **Y-axis:** Accuracy (%), ranging from 0% to 100%.
* **Legend (located in the bottom-right):**
* **Blue Line with Plus Markers:** Gemma Original
* **Light Yellow Line:** Gemma Oracle
* **Orange Line with Plus Markers:** Gemma Bayesian
* **Dashed Gray Line with Diamond Markers:** Bayesian Assistant
### Detailed Analysis
**Chart a: Distribution of Reward Function**
* The distribution is highly uneven, with most reward function indices having very low probabilities.
* There are several spikes indicating reward function indices with significantly higher probabilities.
* The highest probability observed is approximately 5%.
**Chart b: Accuracy on Human Reward Fn. Set**
* **Gemma Original (Blue):** Starts at approximately 54% accuracy at 0 interactions, dips slightly to around 51% at 1 interaction, and then remains relatively constant at approximately 53% for the remaining interactions.
* **Gemma Oracle (Light Yellow):** Starts at approximately 38% accuracy at 0 interactions, increases to approximately 52% at 1 interaction, and then gradually increases to approximately 60% at 5 interactions.
* **Gemma Bayesian (Orange):** Starts at approximately 25% accuracy at 0 interactions, increases sharply to approximately 52% at 1 interaction, and then gradually increases to approximately 77% at 5 interactions.
* **Bayesian Assistant (Dashed Gray):** Starts at approximately 38% accuracy at 0 interactions, increases to approximately 52% at 1 interaction, and then gradually increases to approximately 82% at 5 interactions.
### Key Observations
* In Chart a, the reward function distribution is sparse, suggesting that only a small subset of reward functions are highly probable.
* In Chart b, Gemma Bayesian and Bayesian Assistant significantly outperform Gemma Original and Gemma Oracle as the number of interactions increases.
* Gemma Original's accuracy remains relatively stable regardless of the number of interactions.
* Bayesian Assistant shows the highest accuracy among all models, especially at higher interaction counts.
### Interpretation
The distribution of the reward function (Chart a) indicates that the reward landscape is not uniform, with certain reward functions being much more likely than others. This could reflect inherent biases or preferences in the environment or the data used to define the reward functions.
The accuracy comparison (Chart b) demonstrates the effectiveness of Bayesian methods (Gemma Bayesian and Bayesian Assistant) in learning from human interactions. These methods show a significant improvement in accuracy as the number of interactions increases, suggesting that they are better at adapting to human preferences or feedback compared to the Gemma Original and Gemma Oracle models. The Gemma Original model's stable accuracy suggests it may not be effectively learning from interactions, while the Gemma Oracle model shows some improvement but not as significant as the Bayesian approaches. The Bayesian Assistant, with its highest accuracy, likely incorporates additional mechanisms or prior knowledge that further enhance its learning capabilities.