\n
## Chart: Reward Function Distribution and Accuracy on Human Reward Function Set
### Overview
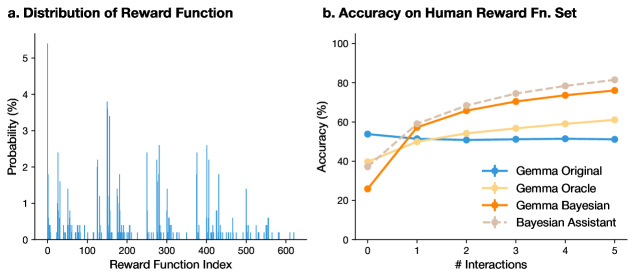
The image presents two charts side-by-side. The first chart (a) displays the distribution of a reward function, showing the probability of each reward function index. The second chart (b) illustrates the accuracy of different models (Gemma Original, Gemma Oracle, Gemma Bayesian, and Bayesian Assistant) on a human reward function set, plotted against the number of interactions.
### Components/Axes
**Chart a: Distribution of Reward Function**
* **X-axis:** Reward Function Index (ranging from approximately 0 to 600)
* **Y-axis:** Probability (%) (ranging from 0 to approximately 3.5)
* **Title:** Distribution of Reward Function
**Chart b: Accuracy on Human Reward Fn. Set**
* **X-axis:** # Interactions (ranging from 0 to 5)
* **Y-axis:** Accuracy (%) (ranging from 0 to 100)
* **Title:** Accuracy on Human Reward Fn. Set
* **Legend:**
* Gemma Original (Blue, marked with triangles)
* Gemma Oracle (Light Orange, marked with circles)
* Gemma Bayesian (Orange, marked with squares)
* Bayesian Assistant (Light Pink, marked with crosses)
### Detailed Analysis or Content Details
**Chart a: Distribution of Reward Function**
The distribution is a histogram-like plot. There is a large peak around an index of approximately 75-125, with a probability of around 3.3%. There are several smaller peaks and valleys throughout the range of reward function indices, indicating a non-uniform distribution. The probability generally decreases as the index moves away from the initial peak, with several smaller peaks appearing between approximately 200 and 550.
**Chart b: Accuracy on Human Reward Fn. Set**
* **Gemma Original (Blue Triangles):** Starts at approximately 55% accuracy at 0 interactions, dips to around 48% at 1 interaction, and remains relatively stable around 50-55% for the remaining interactions.
* **Gemma Oracle (Light Orange Circles):** Starts at approximately 25% accuracy at 0 interactions, rises sharply to around 60% at 1 interaction, and continues to increase to approximately 75% at 5 interactions.
* **Gemma Bayesian (Orange Squares):** Starts at approximately 45% accuracy at 0 interactions, rises to around 70% at 2 interactions, and continues to increase to approximately 78% at 5 interactions.
* **Bayesian Assistant (Light Pink Crosses):** Starts at approximately 50% accuracy at 0 interactions, rises to around 65% at 1 interaction, and continues to increase to approximately 80% at 5 interactions.
### Key Observations
* The reward function distribution (Chart a) is highly variable, with a prominent peak and numerous smaller fluctuations.
* In Chart b, the Gemma Oracle, Gemma Bayesian, and Bayesian Assistant models all demonstrate an increasing trend in accuracy as the number of interactions increases.
* The Gemma Original model shows a slight decrease in accuracy after the first interaction and remains relatively flat.
* The Bayesian Assistant consistently achieves the highest accuracy across all interaction levels.
* The Gemma Oracle shows the most significant improvement in accuracy with increasing interactions.
### Interpretation
The distribution of the reward function (Chart a) suggests that the reward landscape is complex and not uniformly distributed. This complexity could pose challenges for reinforcement learning algorithms.
Chart b demonstrates the effectiveness of incorporating Bayesian methods and oracle feedback into the Gemma models. The Gemma Oracle, which presumably benefits from access to perfect information, shows a substantial improvement in accuracy with more interactions. The Gemma Bayesian and Bayesian Assistant models also exhibit improved performance, indicating that Bayesian inference can help the models learn more effectively from limited data. The relatively flat performance of the Gemma Original model suggests that it struggles to adapt to the human reward function set without the benefits of oracle feedback or Bayesian reasoning. The consistent high performance of the Bayesian Assistant suggests it is the most robust and effective model for this task. The initial dip in accuracy for Gemma Original could be due to overfitting to the initial data or a temporary instability during the learning process.