## Line Graph and Bar Chart: Reward Function Distribution and Accuracy Trends
### Overview
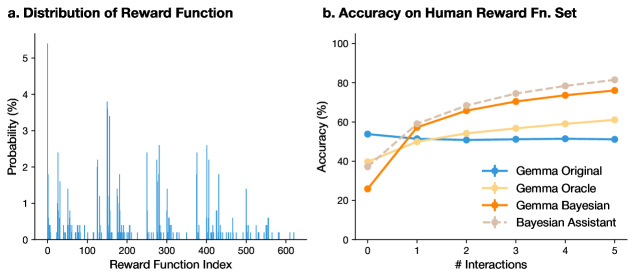
The image contains two side-by-side visualizations:
1. **Left (Bar Chart)**: "a. Distribution of Reward Function" showing probability (%) across Reward Function Index (0–600).
2. **Right (Line Graph)**: "b. Accuracy on Human Reward Fn. Set" comparing four methods (Gamma Original, Gamma Oracle, Gamma Bayesian, Bayesian Assistant) across 0–5 interactions.
---
### Components/Axes
#### Left Chart (Bar Chart):
- **Title**: "a. Distribution of Reward Function"
- **Y-Axis**: "Probability (%)" (scale: 0–5%)
- **X-Axis**: "Reward Function Index" (0–600, integer steps)
- **Legend**: Not explicitly labeled (bars are blue).
#### Right Chart (Line Graph):
- **Title**: "b. Accuracy on Human Reward Fn. Set"
- **Y-Axis**: "Accuracy (%)" (scale: 0–100%)
- **X-Axis**: "# Interactions" (0–5, integer steps)
- **Legend**:
- **Blue (+)**: Gamma Original
- **Yellow (+)**: Gamma Oracle
- **Orange (+)**: Gamma Bayesian
- **Gray (dashed)**: Bayesian Assistant
---
### Detailed Analysis
#### Left Chart (Bar Chart):
- **Distribution**:
- Multimodal with sharp peaks at indices ~0, 100, 200, 300, 400, 500.
- Peaks vary in height (e.g., ~5% at index 0, ~4% at index 200, ~3% at index 400).
- Most indices have low probability (<1%), with sparse data beyond index 500.
#### Right Chart (Line Graph):
- **Trends**:
1. **Gamma Original (Blue)**: Flat line at ~50% accuracy across all interactions.
2. **Gamma Oracle (Yellow)**: Starts at ~40% (0 interactions), rises to ~60% by 5 interactions.
3. **Gamma Bayesian (Orange)**: Starts at ~20% (0 interactions), steeply increases to ~80% by 5 interactions.
4. **Bayesian Assistant (Gray, dashed)**: Starts at ~30% (0 interactions), rises to ~85% by 5 interactions.
- **Notable**:
- Gamma Bayesian and Bayesian Assistant show the steepest improvement.
- Bayesian Assistant’s dashed line suggests a projected or smoothed trend.
---
### Key Observations
1. **Left Chart**:
- Reward functions are unevenly distributed, with a few dominant indices.
- No clear pattern in peak positions or magnitudes.
2. **Right Chart**:
- All methods improve with more interactions, but Gamma Bayesian and Bayesian Assistant outperform others.
- Gamma Original’s stagnation suggests poor adaptability.
---
### Interpretation
- **Reward Function Distribution**: The left chart implies that certain reward functions are more prevalent or effective, but the sparse data limits conclusions.
- **Accuracy Trends**:
- **Gamma Bayesian** and **Bayesian Assistant** demonstrate superior performance, likely due to adaptive learning or probabilistic modeling.
- **Gamma Original**’s flat line indicates it fails to leverage interactions, possibly due to rigid parameterization.
- The **Bayesian Assistant**’s dashed line may represent a confidence interval or ensemble average, suggesting robustness.
- **Implications**: Bayesian methods (especially Bayesian Assistant) are more effective for dynamic reward function optimization, aligning with principles of probabilistic reasoning and iterative improvement.
---
**Note**: Exact numerical values for bar heights and line points are approximated due to lack of gridlines or numerical annotations. Trends are inferred from visual slopes and relative positioning.