# Technical Document Extraction: UV Slope vs. IRX Plot
## Axes and Labels
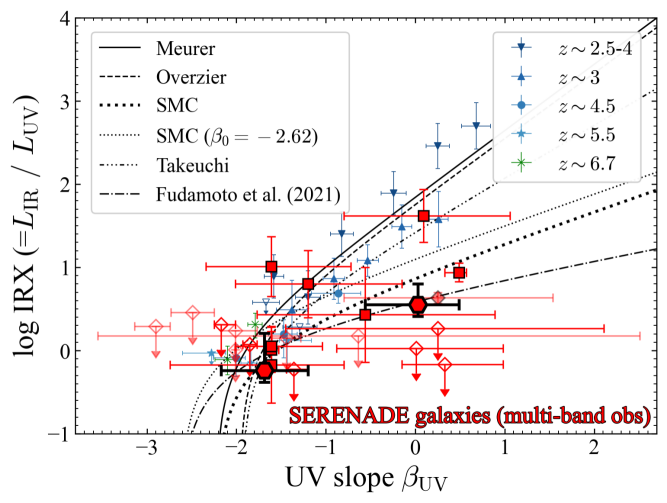
- **Y-Axis**: `log IRX (=L_IR / L_UV)`
- Units: Logarithmic scale of infrared excess (IRX) relative to UV luminosity.
- Range: -1 to 4.
- **X-Axis**: `UV slope β_UV`
- Units: UV spectral slope parameter.
- Range: -3 to 2.
## Legend and Data Series
### Models/Theories (Lines)
1. **Meurer**
- Style: Solid black line.
- Trend: Gradual upward slope.
2. **Overzier**
- Style: Dashed black line.
- Trend: Steeper upward slope than Meurer.
3. **SMC**
- Style: Dotted black line.
- Trend: Moderate upward slope.
4. **SMC (β₀ = -2.62)**
- Style: Dotted black line with offset.
- Trend: Similar to SMC but shifted.
5. **Takeuchi**
- Style: Dash-dot black line.
- Trend: Steeper than SMC.
6. **Fudamoto et al. (2021)**
- Style: Dash-dot black line.
- Trend: Steepest among models.
### Observational Data (Points)
- **SERENADE Galaxies (Multi-band Obs)**
- Symbol: Red squares.
- Placement: Clustered around β_UV ≈ -2 to 0, log IRX ≈ 0 to 1.
- Error Bars: Vertical (log IRX) and horizontal (β_UV).
- **Redshift-Binned Data**
- **z ~ 2.5–4**: Blue triangles.
- Placement: β_UV ≈ -2 to 0, log IRX ≈ 0.5 to 2.
- **z ~ 3**: Blue triangles (darker shade).
- Placement: β_UV ≈ -1.5 to 0, log IRX ≈ 1 to 2.
- **z ~ 4.5**: Blue circles.
- Placement: β_UV ≈ -1 to 0, log IRX ≈ 1.5 to 2.5.
- **z ~ 5.5**: Blue stars.
- Placement: β_UV ≈ -0.5 to 0, log IRX ≈ 2 to 3.
- **z ~ 6.7**: Green asterisk.
- Placement: β_UV ≈ -0.2, log IRX ≈ 2.5.
## Spatial Grounding
- **Legend Position**: Top-left corner.
- **Data Point Colors**:
- Blue (z ~ 2.5–5.5), Green (z ~ 6.7), Red (SERENADE).
- Confirmed: All symbols match legend entries.
## Trend Verification
- **Model Lines**:
- All models show increasing log IRX with rising β_UV.
- Steepest: Fudamoto et al. (2021).
- Shallowest: Meurer.
- **Observational Trends**:
- SERENADE galaxies align with mid-to-high β_UV and moderate log IRX.
- Higher-z data (e.g., z ~ 5.5) trend toward higher log IRX at lower β_UV.
## Component Isolation
1. **Header**: Legend (top-left).
2. **Main Chart**:
- Scatter plot of SERENADE galaxies (red squares).
- Overlaid model lines (black).
- Redshift-binned data (blue/green symbols).
3. **Footer**: None.
## Critical Observations
- **SERENADE Galaxies**:
- Multi-band observations (red squares) show a tight correlation between β_UV and log IRX.
- Error bars indicate significant uncertainty in β_UV measurements.
- **Model Discrepancies**:
- Observational data (SERENADE) deviate from some model predictions (e.g., SMC, Takeuchi).
- Higher-z data (blue symbols) generally align better with steeper models (Fudamoto et al.).
## Missing Information
- No explicit numerical data table provided.
- No textual description of methodologies or assumptions.
## Conclusion
The plot compares theoretical models of UV slope (β_UV) vs. infrared excess (log IRX) with observational data from SERENADE galaxies and redshift-binned samples. Key trends include model-dependent slopes and observational alignment with higher-z data favoring steeper models.