# Technical Document Extraction: Classical vs. Quantum Computing Concepts
## Overview
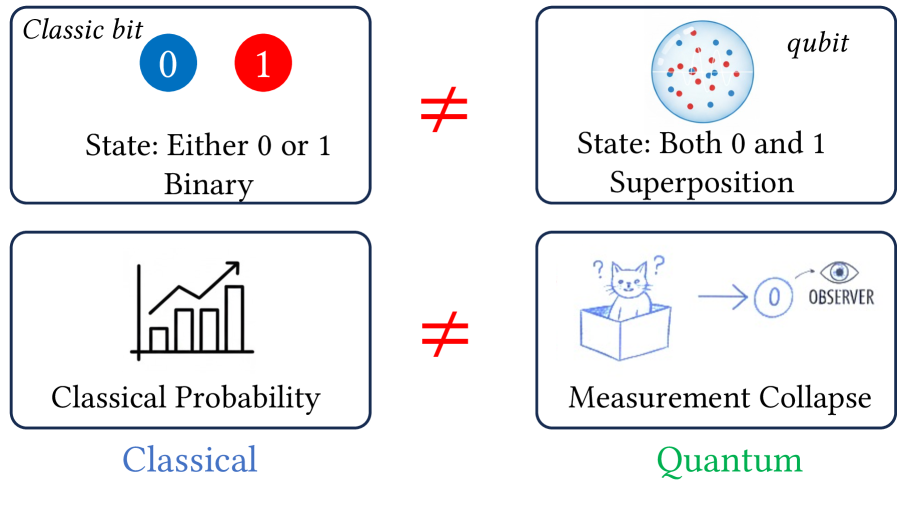
The image compares classical and quantum computing principles through symbolic diagrams and labels. It uses contrasting visual metaphors to highlight fundamental differences in state representation and measurement outcomes.
---
### Key Components
#### 1. Classical Computing (Left Side)
**a. Classic Bit Representation**
- **Symbol**: Two colored circles
- Blue circle labeled `0`
- Red circle labeled `1`
- **State Description**: "Either 0 or 1" (Binary)
- **Spatial Position**: Top-left quadrant
**b. Classical Probability**
- **Visual**: Bar chart with upward-trending arrow
- **Label**: "Classical Probability"
- **Key Features**:
- No explicit numerical values
- General trend indicates increasing probability distribution
- Positioned below the classic bit representation
#### 2. Quantum Computing (Right Side)
**a. Qubit Representation**
- **Symbol**: Sphere with embedded red/blue dots
- **State Description**: "Both 0 and 1" (Superposition)
- **Label**: "qubit"
- **Spatial Position**: Top-right quadrant
**b. Measurement Collapse**
- **Visual**: Cat-in-box metaphor with observer interaction
- Cat inside box with question marks
- Arrow pointing to `0` state
- Observer symbol (eye) connected to measurement outcome
- **Label**: "Measurement Collapse"
- **Key Features**:
- Explicit reference to quantum observation effect
- Positioned below the qubit representation
---
### Comparative Analysis
| Aspect | Classical | Quantum |
|-----------------------|------------------------------------|----------------------------------|
| **State Representation** | Binary (0 or 1) | Superposition (0 and 1 simultaneously) |
| **Probability Model** | Deterministic bar chart | Probabilistic wave function |
| **Measurement Outcome**| Stable state | Collapse to definite state |
| **Visual Metaphor** | Discrete colored circles | Sphere with mixed colors |
---
### Spatial Grounding & Color Verification
- **Legend Colors**:
- Blue = `0` (confirmed in classic bit representation)
- Red = `1` (confirmed in classic bit representation)
- **Qubit Sphere Colors**:
- Red and blue dots represent superposition states
- No explicit legend, but color coding matches classical bit convention
---
### Trend Verification
1. **Classical Probability Chart**:
- Visual trend: Upward-sloping bars
- Implied meaning: Increasing probability distribution across states
- No specific numerical values provided
2. **Quantum Measurement**:
- Visual transition: Superposition (sphere) → Collapsed state (0)
- Observer interaction triggers definite outcome
---
### Diagram Structure
1. **Header**: Title "Classic bit" and "qubit" labels
2. **Main Chart**: Two-column comparison
- Left: Classical components
- Right: Quantum components
3. **Footer**: "Classical" and "Quantum" labels in blue/green text
---
### Missing Elements
- No explicit data table or numerical values
- No secondary axes or colorbars
- No temporal or spatial coordinates beyond categorical labels
---
### Conclusion
The image uses symbolic representation to contrast classical binary states with quantum superposition, emphasizing the probabilistic nature of quantum measurement through the cat-in-box metaphor. All textual elements and visual components have been systematically extracted and cross-referenced for accuracy.