\n
## Diagram: System Flow
### Overview
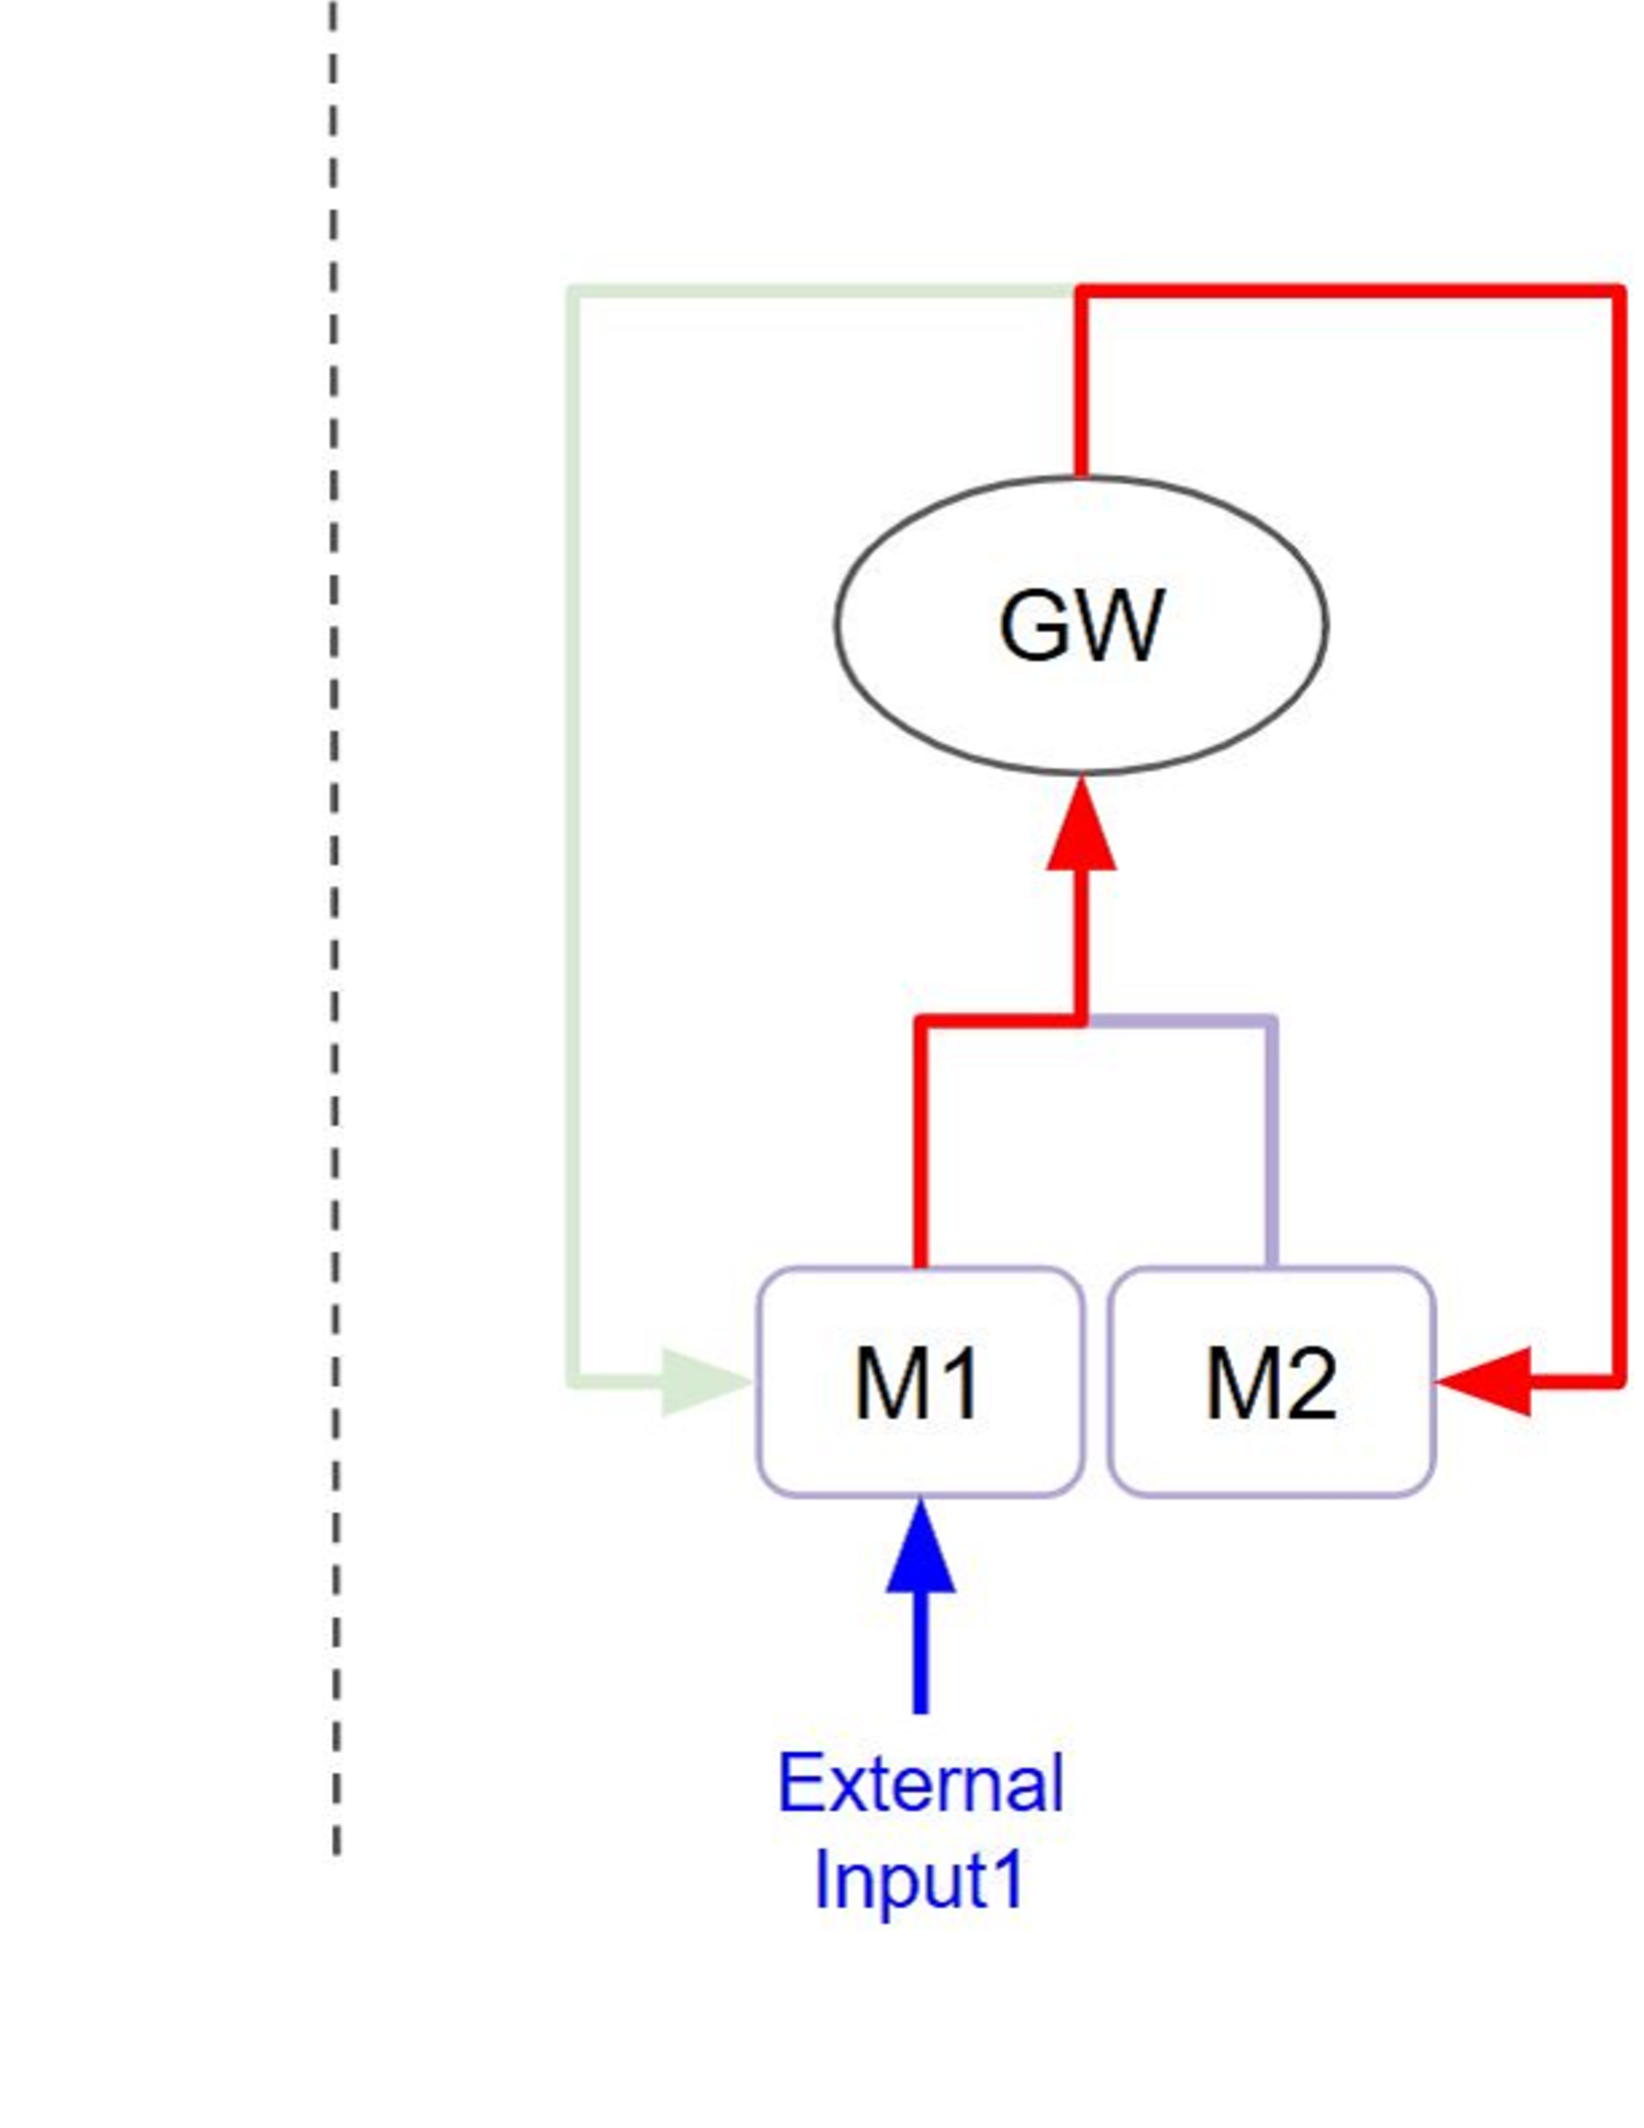
The image depicts a system flow diagram with several components and connections. The diagram illustrates a process involving an external input, two modules (M1 and M2), and a gateway (GW), with a feedback loop. The diagram is enclosed within a green rectangular border, with a dashed grey line on the left side.
### Components/Axes
The diagram contains the following components:
* **GW:** Gateway (represented as a circle)
* **M1:** Module 1 (represented as a rectangle)
* **M2:** Module 2 (represented as a rectangle)
* **External Input1:** Input source (labeled text)
The connections between the components are represented by arrows of different colors:
* **Green Arrow:** Connects the external environment (left side) to M1.
* **Red Arrow:** Forms a feedback loop from M2 to the external environment and then to GW.
* **Red Arrow:** Connects GW to M1.
* **Black Arrow:** Connects M1 to M2.
### Detailed Analysis or Content Details
The diagram shows the following flow:
1. **External Input1** provides input to **M1** via a green arrow.
2. **M1** passes data to **M2** via a black arrow.
3. **M2** sends data to the external environment via a red arrow.
4. The external environment sends data back to **GW** via a red arrow.
5. **GW** sends data to **M1** via a red arrow.
The entire system is contained within a green rectangular border. A dashed grey line is present on the left side of the border, potentially indicating a boundary or external interface.
### Key Observations
The diagram highlights a closed-loop system with feedback. The feedback loop involves M2, the external environment, and GW. The gateway (GW) appears to act as a central control or processing unit, receiving input from the external environment and providing input to M1. The two modules, M1 and M2, seem to perform sequential processing steps.
### Interpretation
This diagram likely represents a control system or a data processing pipeline. The external input initiates a process that flows through M1 and M2, with the output of M2 influencing the system through a feedback loop. The gateway (GW) likely regulates or modifies the process based on the feedback received. The green border suggests a defined system boundary, while the dashed line might indicate an interface with other systems or the external world. The diagram is abstract and doesn't provide specific details about the functions of each component or the nature of the data being processed. It focuses on the overall flow and relationships between the components.