## Scatter Plot: Projection of activations on tG and tP
### Overview
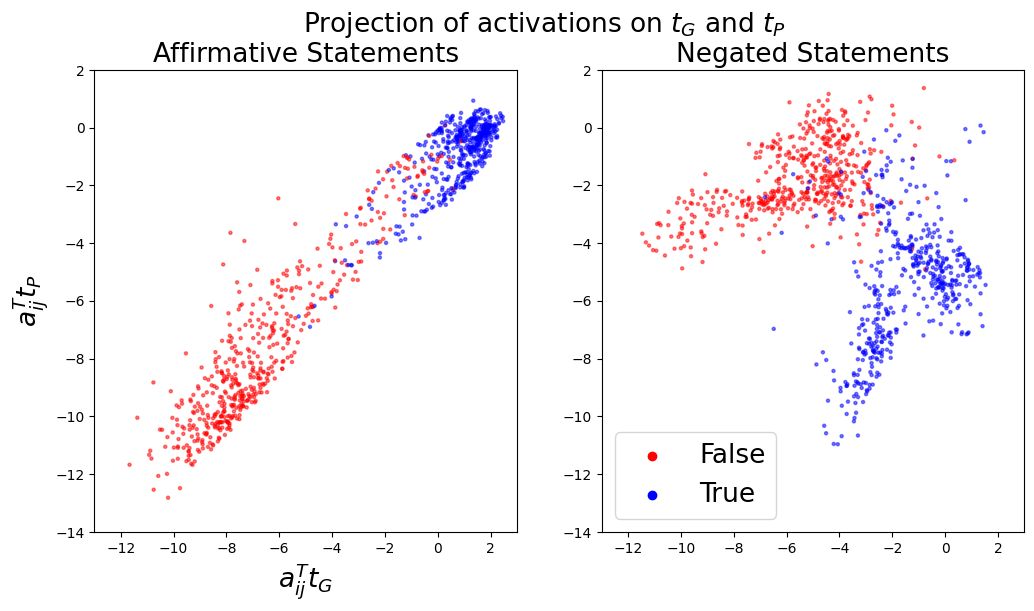
The image contains two scatter plots, side by side, displaying the projection of activations on tG and tP for affirmative and negated statements. Each plot shows data points colored red and blue, representing "False" and "True" respectively. The x-axis represents a_ij^T t_G, and the y-axis represents a_ij^T t_P.
### Components/Axes
* **Title:** Projection of activations on tG and tP
* **Left Plot Title:** Affirmative Statements
* **Right Plot Title:** Negated Statements
* **X-axis Label (both plots):** a_ij^T t_G
* Scale: -12 to 2, with tick marks at -12, -10, -8, -6, -4, -2, 0, 2
* **Y-axis Label (both plots):** a_ij^T t_P
* Scale: -14 to 2, with tick marks at -12, -10, -8, -6, -4, -2, 0, 2
* **Legend (bottom-right):**
* Red: False
* Blue: True
### Detailed Analysis
**Left Plot: Affirmative Statements**
* **Red (False) Data Points:** These points form a cluster that slopes upwards from the bottom-left to the top-right. The x-values range from approximately -12 to 0, and the y-values range from approximately -12 to 0.
* **Blue (True) Data Points:** These points are clustered in the top-right corner of the plot. The x-values range from approximately -4 to 2, and the y-values range from approximately -4 to 2.
**Right Plot: Negated Statements**
* **Red (False) Data Points:** These points are clustered in the top-left portion of the plot. The x-values range from approximately -12 to -2, and the y-values range from approximately -6 to 0.
* **Blue (True) Data Points:** These points are clustered in the bottom-center portion of the plot. The x-values range from approximately -6 to 2, and the y-values range from approximately -12 to -2.
### Key Observations
* In the "Affirmative Statements" plot, there is a clear separation between the "False" and "True" data points.
* In the "Negated Statements" plot, the "False" and "True" data points form distinct clusters, but there is some overlap.
* The distribution of data points differs significantly between affirmative and negated statements.
### Interpretation
The scatter plots visualize how activations are projected onto tG and tP for affirmative and negated statements, with data points colored to indicate whether the statement is "True" or "False". The plots suggest that the model represents affirmative and negated statements differently in the activation space. The clear separation in the "Affirmative Statements" plot indicates that the model can easily distinguish between true and false affirmative statements based on these projections. The "Negated Statements" plot shows a more complex relationship, with some overlap between the "True" and "False" clusters, suggesting that negated statements may be more difficult for the model to classify accurately. The clustering of data points indicates that the model has learned to represent these statements in a structured way within the activation space.