## Scatter Plots: Projection of activations on t_G and t_P
### Overview
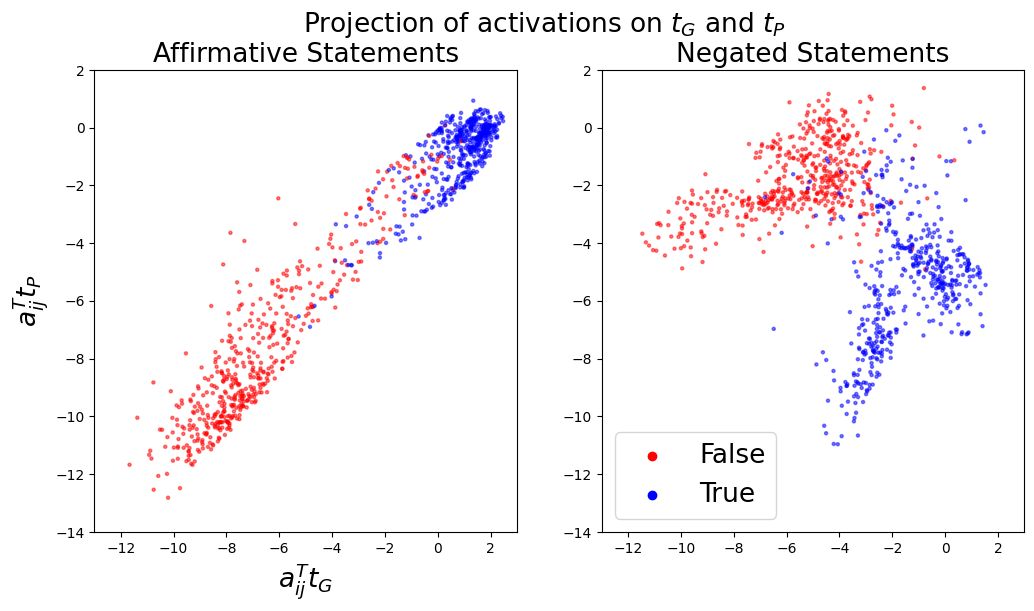
The image contains two scatter plots comparing activation projections on two variables, **t_G** (likely "generator" or "ground truth") and **t_P** (likely "prediction" or "projection"). The plots are split into **Affirmative Statements** (left) and **Negated Statements** (right). Data points are color-coded: **red** for "False" and **blue** for "True". Both plots show a diagonal trend, but with distinct distributions.
---
### Components/Axes
- **X-axis**: `a^T_ij t_G` (activation projection on t_G), ranging from **-14 to 2**.
- **Y-axis**: `a^T_ij t_P` (activation projection on t_P), ranging from **-14 to 2**.
- **Legend**: Located in the **bottom-right corner** of each plot.
- **Red**: "False" (incorrect predictions).
- **Blue**: "True" (correct predictions).
- **Plot Titles**:
- Left: "Affirmative Statements".
- Right: "Negated Statements".
---
### Detailed Analysis
#### Affirmative Statements (Left Plot)
- **Trend**: A strong diagonal cluster from **bottom-left (-14, -14)** to **top-right (2, 2)**.
- **Data Distribution**:
- **Red ("False")**: Concentrated in the **lower-left quadrant** (x ≈ -12 to -6, y ≈ -12 to -8).
- **Blue ("True")**: Dominates the **upper-right quadrant** (x ≈ -4 to 2, y ≈ -4 to 2).
- **Key Pattern**: A clear separation between "True" and "False" predictions along the diagonal.
#### Negated Statements (Right Plot)
- **Trend**: A more dispersed distribution with no strong diagonal alignment.
- **Data Distribution**:
- **Red ("False")**: Scattered across the **left half** (x ≈ -12 to -4, y ≈ -10 to -2).
- **Blue ("True")**: Forms a **loose diagonal** from **bottom-left (-12, -12)** to **top-right (2, 2)**, but with significant overlap with red points.
- **Key Pattern**: Less distinct separation between "True" and "False" compared to the Affirmative plot.
---
### Key Observations
1. **Affirmative Statements**:
- Strong correlation between high `t_P` and `t_G` activations for "True" predictions.
- "False" predictions cluster in regions of low `t_G` and `t_P` activations.
2. **Negated Statements**:
- Weaker correlation between `t_G` and `t_P` activations.
- Overlap between "True" and "False" predictions suggests ambiguity in negation handling.
3. **Color Consistency**:
- Red ("False") and blue ("True") labels match the legend in both plots.
- No mismatches observed between color and legend.
---
### Interpretation
The data suggests that the model performs better at **affirmative statements** than **negated statements**. In the Affirmative plot, "True" predictions align with higher activations in both `t_G` and `t_P`, indicating a robust relationship. For Negated statements, the lack of clear separation implies the model struggles to distinguish between correct and incorrect predictions, possibly due to syntactic or semantic complexity in negation. The diagonal trend in both plots hints at a shared latent space where `t_G` and `t_P` activations are interdependent, but the divergence in scatter density highlights task-specific challenges.