## Scatter Plot: Timing vs. Guess
### Overview
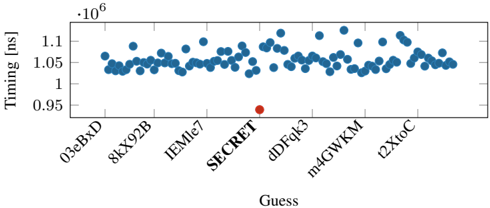
The image is a scatter plot showing the timing (in nanoseconds) for different guesses. The x-axis represents the "Guess", and the y-axis represents the "Timing [ns]". Most guesses have a timing around 1.05 * 10^6 ns, while one guess labeled "SECRET" has a significantly lower timing.
### Components/Axes
* **X-axis:** "Guess" with labels: "03eBxD", "8kX92B", "IEMle7", "SECRET", "dDFqk3", "m4GWKM", "t2XtoC".
* **Y-axis:** "Timing [ns]" with scale markers: 0.95 * 10^6, 1 * 10^6, 1.05 * 10^6, 1.1 * 10^6.
### Detailed Analysis
* **Blue Data Points:** The blue data points represent the timing for each guess, except for the "SECRET" guess. The blue points are clustered around 1.04 * 10^6 ns to 1.12 * 10^6 ns.
* **03eBxD:** Timing values range from approximately 1.03 * 10^6 ns to 1.07 * 10^6 ns.
* **8kX92B:** Timing values range from approximately 1.04 * 10^6 ns to 1.06 * 10^6 ns.
* **IEMle7:** Timing values range from approximately 1.04 * 10^6 ns to 1.09 * 10^6 ns.
* **dDFqk3:** Timing values range from approximately 1.04 * 10^6 ns to 1.12 * 10^6 ns.
* **m4GWKM:** Timing values range from approximately 1.03 * 10^6 ns to 1.12 * 10^6 ns.
* **t2XtoC:** Timing values range from approximately 1.04 * 10^6 ns to 1.08 * 10^6 ns.
* **Red Data Point:** The red data point represents the timing for the "SECRET" guess. It has a timing value of approximately 0.94 * 10^6 ns.
### Key Observations
* The timing for the "SECRET" guess is significantly lower than the timing for other guesses.
* The timing values for the other guesses are relatively consistent, ranging from approximately 1.03 * 10^6 ns to 1.12 * 10^6 ns.
### Interpretation
The scatter plot suggests that the "SECRET" guess has a significantly different timing profile compared to the other guesses. This could indicate that the "SECRET" guess triggers a different code path or algorithm, resulting in a faster execution time. The consistent timing values for the other guesses suggest that they might be processed similarly. The plot highlights the "SECRET" guess as an outlier, potentially revealing information about the system's behavior when the correct secret is provided.