\n
## Scatter Plot: Timing vs. Guess
### Overview
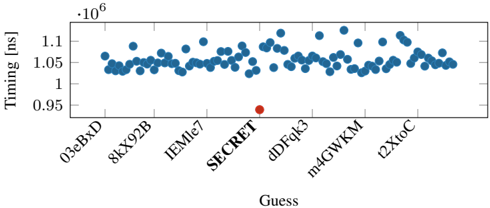
This image presents a scatter plot visualizing the relationship between "Guess" values on the x-axis and "Timing" in nanoseconds (ns) on the y-axis. The plot displays a series of data points, with one outlier significantly deviating from the general trend.
### Components/Axes
* **X-axis Label:** "Guess"
* Categories: 03eBxD, 8kX92B, IEMle7, SECRET, dDFqk3, m4GWKM, l2XtoC
* **Y-axis Label:** "Timing [ns]" (Timing in nanoseconds)
* Scale: Ranges approximately from 0.95 x 10<sup>6</sup> ns to 1.12 x 10<sup>6</sup> ns.
* **Data Points:** Blue circles representing timing measurements for each guess.
* **Outlier:** A single red circle, visually distinct from the blue data points.
### Detailed Analysis
The majority of the data points cluster between approximately 1.03 x 10<sup>6</sup> ns and 1.1 x 10<sup>6</sup> ns. The data points appear relatively scattered with no strong linear trend.
Let's analyze the data points for each "Guess" category:
* **03eBxD:** Timing values range from approximately 1.04 x 10<sup>6</sup> ns to 1.08 x 10<sup>6</sup> ns.
* **8kX92B:** Timing values range from approximately 1.03 x 10<sup>6</sup> ns to 1.09 x 10<sup>6</sup> ns.
* **IEMle7:** Timing values range from approximately 1.04 x 10<sup>6</sup> ns to 1.1 x 10<sup>6</sup> ns.
* **SECRET:** Timing value is approximately 0.96 x 10<sup>6</sup> ns (the outlier, marked in red).
* **dDFqk3:** Timing values range from approximately 1.04 x 10<sup>6</sup> ns to 1.1 x 10<sup>6</sup> ns.
* **m4GWKM:** Timing values range from approximately 1.03 x 10<sup>6</sup> ns to 1.08 x 10<sup>6</sup> ns.
* **l2XtoC:** Timing values range from approximately 1.04 x 10<sup>6</sup> ns to 1.08 x 10<sup>6</sup> ns.
The outlier, "SECRET", has a timing value significantly lower than all other guesses, at approximately 0.96 x 10<sup>6</sup> ns.
### Key Observations
* The timing values for most guesses are relatively consistent, fluctuating within a narrow range.
* The "SECRET" guess exhibits a dramatically lower timing value, making it a clear outlier.
* There is no obvious correlation between the "Guess" category and the "Timing" value, except for the outlier.
### Interpretation
The data suggests that the timing performance is generally stable across different "Guess" values. However, the "SECRET" guess stands out as an anomaly, indicating significantly faster processing or execution time compared to the others. This could be due to several factors:
* **Optimization:** The "SECRET" guess might be optimized for faster processing.
* **Algorithm:** The algorithm used for the "SECRET" guess might be more efficient.
* **Data Characteristics:** The data associated with the "SECRET" guess might have properties that lead to faster processing.
* **Error:** There is a possibility of an error in the measurement or recording of the timing value for "SECRET".
Further investigation is needed to understand the underlying reasons for this significant difference in timing performance. The outlier suggests a potential area for optimization or a unique characteristic of the "SECRET" guess that warrants further analysis.