## Heatmap: Timing Analysis
### Overview
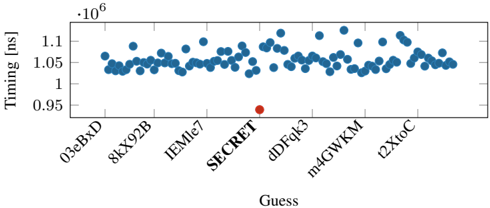
The heatmap displays the timing measurements for various cryptographic algorithms. The x-axis represents different algorithms, while the y-axis shows the timing in nanoseconds (ns).
### Components/Axes
- **X-axis**: Algorithms (03eBxD, 8kX92B, IEMle7, SECRET, dDFqk3, m4GWKM, 2XioC)
- **Y-axis**: Timing in nanoseconds (ns)
- **Color Scale**: Blue to red, indicating increasing timing
### Detailed Analysis or ### Content Details
The heatmap shows a range of timing values for each algorithm. The majority of the points are clustered around the 1 ns mark, indicating that most algorithms have a similar timing performance. However, there are some outliers, such as the SECRET algorithm, which has a significantly higher timing value.
### Key Observations
- The majority of algorithms have a similar timing performance.
- The SECRET algorithm has a significantly higher timing value compared to others.
- There are no clear trends or patterns in the data.
### Interpretation
The heatmap suggests that the timing performance of the algorithms is relatively consistent. However, the SECRET algorithm has a significantly higher timing value, which could indicate a potential security vulnerability or a performance issue. Further analysis would be needed to determine the cause of this discrepancy.