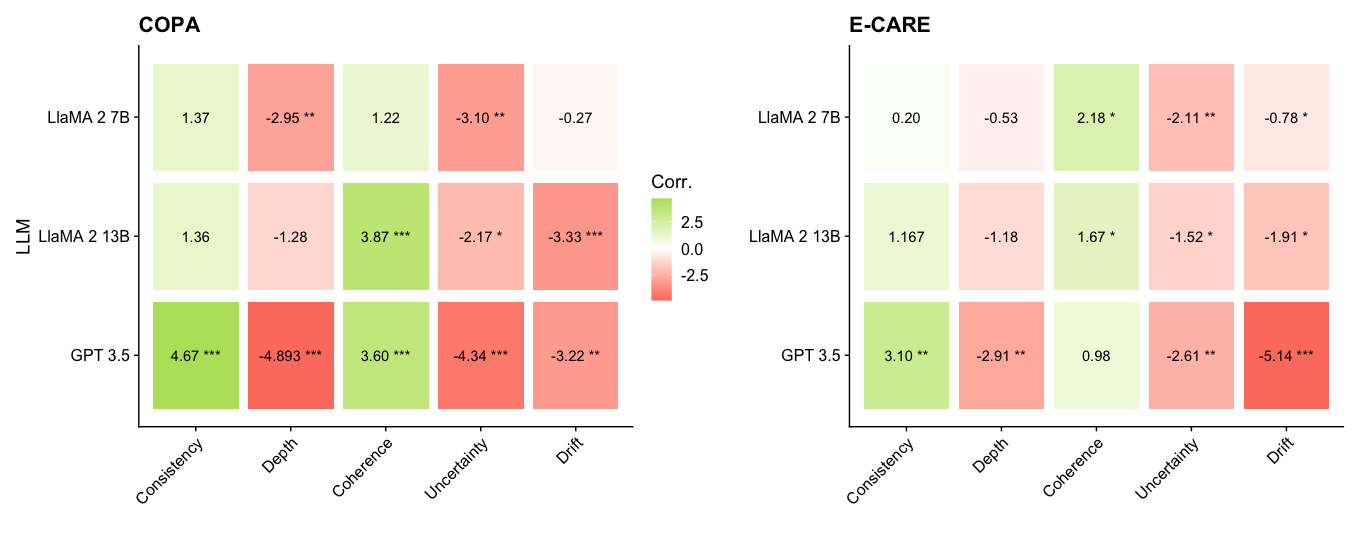
## Heatmap: LLM Performance on COPA and E-CARE
### Overview
The image presents two heatmaps comparing the performance of three Large Language Models (LLMs) - LLaMA 2 7B, LLaMA 2 13B, and GPT 3.5 - on two tasks: COPA and E-CARE. The heatmaps display correlation values between the LLMs and different aspects of the tasks: Consistency, Depth, Coherence, Uncertainty, and Drift. The color intensity represents the strength and direction (positive or negative) of the correlation, with green indicating positive correlation and red indicating negative correlation. Significance levels are indicated by asterisks (*, **, ***).
### Components/Axes
* **Titles:** "COPA" (left heatmap), "E-CARE" (right heatmap)
* **Y-axis Label:** "LLM"
* **Y-axis Categories:** LLaMA 2 7B, LLaMA 2 13B, GPT 3.5
* **X-axis Categories:** Consistency, Depth, Coherence, Uncertainty, Drift
* **Color Scale (Corr.):**
* Green: Positive correlation, ranging up to 2.5
* White: 0 correlation
* Red: Negative correlation, ranging down to -2.5
* **Significance Levels:**
* \* : p < 0.05
* \*\* : p < 0.01
* \*\*\* : p < 0.001
### Detailed Analysis
#### COPA Heatmap
| LLM | Consistency | Depth | Coherence | Uncertainty | Drift |
|-------------|-------------|-----------|-----------|-------------|-----------|
| LLaMA 2 7B | 1.37 | -2.95\*\* | 1.22 | -3.10\*\* | -0.27 |
| LLaMA 2 13B | 1.36 | -1.28 | 3.87\*\*\* | -2.17\* | -3.33\*\*\* |
| GPT 3.5 | 4.67\*\*\* | -4.893\*\*\* | 3.60\*\*\* | -4.34\*\*\* | -3.22\*\* |
* **LLaMA 2 7B:**
* Consistency: 1.37 (light green)
* Depth: -2.95\*\* (red)
* Coherence: 1.22 (light green)
* Uncertainty: -3.10\*\* (red)
* Drift: -0.27 (light red)
* **LLaMA 2 13B:**
* Consistency: 1.36 (light green)
* Depth: -1.28 (light red)
* Coherence: 3.87\*\*\* (green)
* Uncertainty: -2.17\* (light red)
* Drift: -3.33\*\*\* (red)
* **GPT 3.5:**
* Consistency: 4.67\*\*\* (dark green)
* Depth: -4.893\*\*\* (dark red)
* Coherence: 3.60\*\*\* (green)
* Uncertainty: -4.34\*\*\* (dark red)
* Drift: -3.22\*\* (red)
#### E-CARE Heatmap
| LLM | Consistency | Depth | Coherence | Uncertainty | Drift |
|-------------|-------------|----------|-----------|-------------|-----------|
| LLaMA 2 7B | 0.20 | -0.53 | 2.18\* | -2.11\*\* | -0.78\* |
| LLaMA 2 13B | 1.167 | -1.18 | 1.67\* | -1.52\* | -1.91\* |
| GPT 3.5 | 3.10\*\* | -2.91\*\* | 0.98 | -2.61\*\* | -5.14\*\*\* |
* **LLaMA 2 7B:**
* Consistency: 0.20 (light green)
* Depth: -0.53 (light red)
* Coherence: 2.18\* (light green)
* Uncertainty: -2.11\*\* (light red)
* Drift: -0.78\* (light red)
* **LLaMA 2 13B:**
* Consistency: 1.167 (light green)
* Depth: -1.18 (light red)
* Coherence: 1.67\* (light green)
* Uncertainty: -1.52\* (light red)
* Drift: -1.91\* (light red)
* **GPT 3.5:**
* Consistency: 3.10\*\* (green)
* Depth: -2.91\*\* (red)
* Coherence: 0.98 (light green)
* Uncertainty: -2.61\*\* (red)
* Drift: -5.14\*\*\* (dark red)
### Key Observations
* **COPA:** GPT 3.5 shows the strongest positive correlation with Consistency and Coherence, but also the strongest negative correlation with Depth, Uncertainty, and Drift. LLaMA 2 13B shows a strong positive correlation with Coherence.
* **E-CARE:** GPT 3.5 shows the strongest positive correlation with Consistency, but also the strongest negative correlation with Drift. All models show negative correlations with Depth, Uncertainty, and Drift.
* **Significance:** GPT 3.5 generally has more statistically significant correlations (higher number of asterisks) compared to the LLaMA models.
* **Consistency:** All models show a positive correlation with Consistency in both tasks.
* **Depth, Uncertainty, Drift:** All models show a negative correlation with Depth, Uncertainty, and Drift in both tasks.
* **Coherence:** All models show a positive correlation with Coherence in both tasks, except for GPT 3.5 in E-CARE, which has a correlation close to 1.
### Interpretation
The heatmaps suggest that GPT 3.5 generally performs better in terms of Consistency and Coherence compared to the LLaMA models, but it also exhibits stronger negative correlations with Depth, Uncertainty, and Drift. This could indicate that while GPT 3.5 is more consistent and coherent, it might be more prone to errors or biases related to depth, uncertainty, and drift. The LLaMA models show more moderate correlations, suggesting a more balanced performance across different aspects of the tasks. The statistical significance of the correlations indicates the reliability of these observations, with GPT 3.5 generally showing more significant correlations. The negative correlations with Depth, Uncertainty, and Drift across all models suggest that these aspects of the tasks are challenging for all LLMs.