## Heatmap: Correlation Analysis of LLM Performance
### Overview
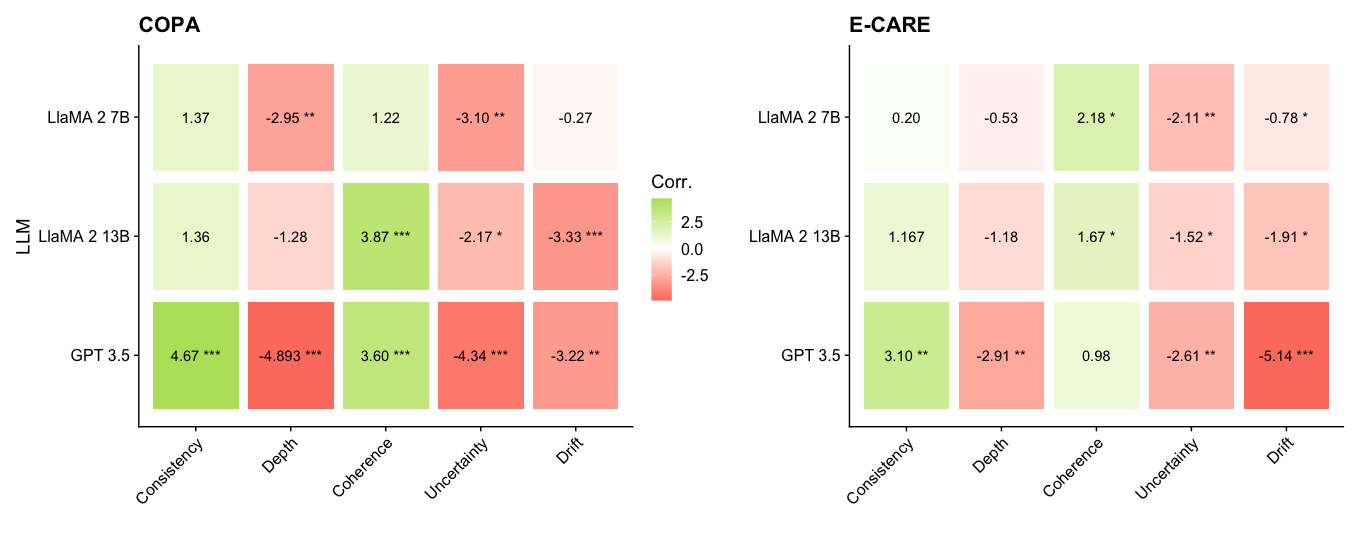
The image presents two heatmaps displaying correlation coefficients between different Large Language Models (LLMs) – LLaMA 2 7B, LLaMA 2 13B, and GPT 3.5 – and various evaluation metrics. The two heatmaps correspond to two different evaluation datasets: COPA and E-CARE. The color intensity represents the strength and direction of the correlation, with green indicating positive correlation and red indicating negative correlation. Significance levels are indicated by asterisks.
### Components/Axes
* **Y-axis:** LLM names (LLaMA 2 7B, LLaMA 2 13B, GPT 3.5).
* **X-axis:** Evaluation metrics (Consistency, Depth, Coherence, Uncertainty, Drift).
* **Color Scale:** Ranges from -2.5 (dark red) to +2.5 (dark green), with 0 represented by white.
* **Significance Markers:**
* `*`: p < 0.05
* `**`: p < 0.01
* `***`: p < 0.001
* **Titles:**
* Left heatmap: "COPA"
* Right heatmap: "E-CARE"
* **Central Label:** "Corr." (indicating correlation)
### Detailed Analysis or Content Details
**COPA Heatmap (Left)**
* **LLaMA 2 7B:**
* Consistency: 1.37
* Depth: -2.95**
* Coherence: 1.22
* Uncertainty: -3.10**
* Drift: -0.27
* **LLaMA 2 13B:**
* Consistency: 1.36
* Depth: -1.28
* Coherence: 3.87***
* Uncertainty: -2.17*
* Drift: -3.33***
* **GPT 3.5:**
* Consistency: 4.67***
* Depth: -4.893***
* Coherence: 3.60***
* Uncertainty: -4.34***
* Drift: -3.22***
**E-CARE Heatmap (Right)**
* **LLaMA 2 7B:**
* Consistency: 0.20
* Depth: -0.53
* Coherence: 2.18*
* Uncertainty: -2.11**
* Drift: -0.78*
* **LLaMA 2 13B:**
* Consistency: 1.167
* Depth: -1.18
* Coherence: 1.67*
* Uncertainty: -1.52*
* Drift: -1.91*
* **GPT 3.5:**
* Consistency: 3.10**
* Depth: -2.91*
* Coherence: 0.98
* Uncertainty: -2.61*
* Drift: -5.14***
### Key Observations
* **GPT 3.5 consistently shows strong correlations (positive or negative) with all metrics in both datasets.** It exhibits the highest absolute correlation values across most metrics.
* **Depth consistently shows negative correlation with all models in both datasets.** This suggests that as the "depth" of the LLM's responses increases, the correlation with other metrics decreases.
* **Coherence shows positive correlation with LLaMA 2 13B and GPT 3.5 in both datasets.**
* **Uncertainty shows negative correlation with all models in both datasets.**
* **Drift shows negative correlation with all models in both datasets.**
* **LLaMA 2 7B generally has lower correlation values compared to LLaMA 2 13B and GPT 3.5.**
* **The significance levels (asterisks) indicate that many of the correlations are statistically significant.**
### Interpretation
The heatmaps reveal how different LLMs perform across various evaluation metrics, as measured by the COPA and E-CARE datasets. The correlation coefficients quantify the linear relationship between the LLM's performance and each metric.
The consistent negative correlation between "Depth" and other metrics suggests a potential trade-off: increasing the depth of responses might negatively impact other qualities like consistency or coherence. The strong correlations observed for GPT 3.5 indicate that its performance is more predictably related to these metrics than the LLaMA models.
The differences between the COPA and E-CARE heatmaps suggest that the correlation patterns are dataset-dependent. The E-CARE dataset appears to show weaker overall correlations compared to COPA, potentially indicating that the E-CARE metrics are less sensitive to the specific characteristics of these LLMs.
The varying significance levels highlight which correlations are statistically robust and likely represent genuine relationships, rather than random chance. The LLaMA 2 7B model consistently shows weaker correlations, suggesting it may be less sensitive to the nuances captured by these metrics compared to the larger models. The presence of statistically significant correlations (indicated by asterisks) provides evidence for the validity of these observed relationships.